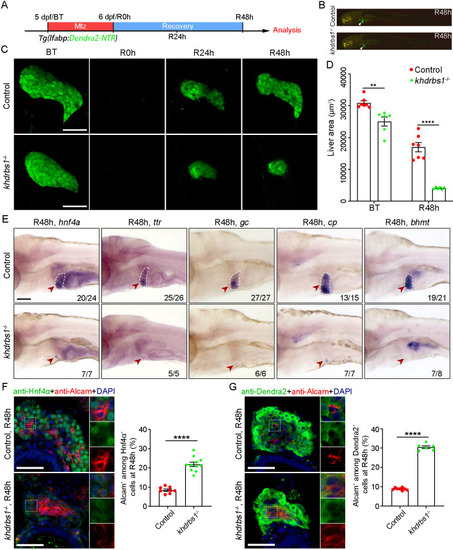
Loss of khdrbs1 impairs the re-differentiation of BPPCs during biliary-mediated liver regeneration. (A) Scheme showing the stage of Mtz treatment and analysis at R48 h. (B) Epifluorescence images showing the body shape and regenerating livers (white arrowheads) of the control and khdrbs1−/− mutant at R48 h. (C) Confocal projection images showing livers of the control and khdrbs1−/− mutant at BT (before treatment), R0 h, R24 h, and R48 h. Scale bars: 100 μm. (D) Quantification of liver area in the control and khdrbs1−/− mutant at BT and R48 h. 5 dpf: control, n=7; khdrbs1−/−, n=6; R48 h: control, n=7; khdrbs1−/−, n=6. (E) WISH images showing expression of the hepatocyte markers hnf4α, ttr, gc, cp, and bhmt in the control and khdrbs1−/− mutant at R48 h. Red arrowheads and white dashed outlines indicate livers. Numbers indicate the proportion of larvae exhibiting the expression/phenotype shown. Scale bar: 100 μm. (F,G) Confocal images and quantification showing the expression of Alcam and Hnf4α or Alcam and Dendra2 at R48 h. Insets show magnified views of regions of interest. F: control, n=8; khdrbs1−/−, n=11; G: control, n=8; khdrbs1−/−, n=6. Error bars represent s.e.m. **P<0.01, ****P<0.0001 (two-tailed, unpaired t-test). Scale bars: 50 μm.
|