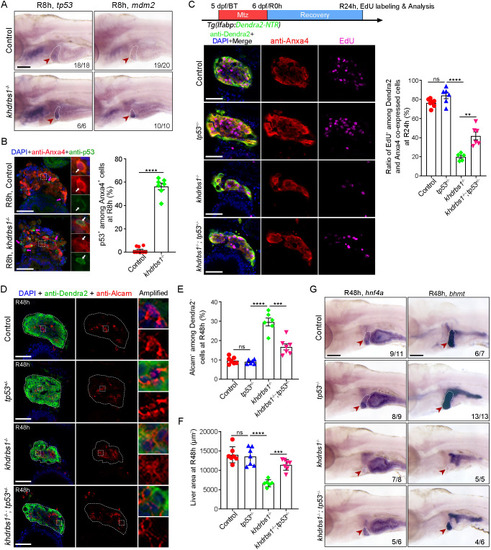
p53 mutation partially rescues liver regeneration in the khdrbs1 mutant. (A) WISH images showing the expression of tp53 and mdm2 in the control and khdrbs1−/− mutant at R8 h. (B) Confocal images and quantification showing the expression of p53 in Anxa4+ cells at R8 h. Insets show magnified views of regions of interest. White arrows point to p53 and Anxa4 co-expressing cells, and magenta arrows point to p53+ and Anxa4− cells. Control, n=9; khdrbs1−/−, n=7. (C) EdU assay (schematic) showing the proliferation of BPPCs after tp53 mutation R24 h. Graph shows quantification of EdU+ among Dendra2 and Anxa4 co-expressing cells. Control, n=7; tp53−/−, n=6; khdrbs1−/−, n=5; khdrbs1−/−;tp53+/−, n=6. (D) Confocal images showing the expression of Alcam and Dendra2 at R48 h. Insets show magnified views of regions of interest. Dashed lines delineate liver region. (E,F) Quantification of Alcam+ cells among Dendra2+ cells (E) or the area of regenerating livers (F) after tp53 mutation at R48 h. Control, n=7; tp53−/−, n=7; khdrbs1−/−, n=6; khdrbs1−/−;tp53+/−, n=7. (G) WISH images showing the expression of hnf4a and bhmt after tp53 mutation at R48 h. Scale bars: 100 μm. In WISH images, red arrowheads and white dashed outlines indicate livers, and numbers indicate the proportion of larvae exhibiting the expression shown. ns, not significant. **P<0.01, ***P<0.001, ****P<0.0001 (two-tailed, unpaired t-test). Error bars represent s.e.m. Scale bars: 100 μm (A); 50 μm (B-D).
|
