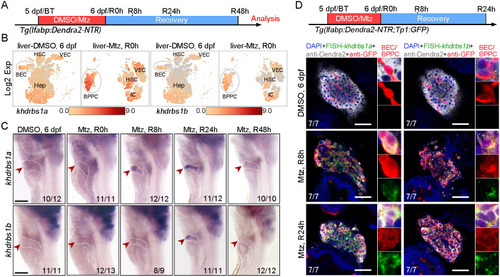
khdrbs1a and khdrbs1b are expressed in BPPCs during liver regeneration. (A) Scheme showing the DMSO or Mtz treatment and analysis stages during liver regeneration. (B) UMAP showing khdrbs1a or khdrbs1b expression (overlaid in red scale) in various liver cell types at 6 dpf and R0 h. BEC, biliary epithelial cell; BPPC, bipotential progenitor cell; Hep, hepatocyte; HSC, hepatic stellate cell; IC, immune cell; VEC, vascular endothelial cell. Black dashed circle indicates BEC/BPPC. (C) WISH images showing the expression patterns of khdrbs1a or khdrbs1b during liver regeneration at 6 dpf, R0 h, R8 h, R24 h, and R48 h. Red arrowheads and white dashed outlines indicate livers. Scale bars: 100 μm. (D) Confocal images showing the expression of khdrbs1a or khdrbs1b in BECs or BPPCs at 6 dpf, R8 h, and R24 h by FISH in Tg(lfabp:Dendra2-NTR; Tp1:GFP) in which hepatocytes and BECs are labeled, respectively. Insets show magnified views of regions of interest. Schematic at the top shows the Mtz treatment and analysis stages. Numbers at the bottom of image panels indicate the proportion of larvae exhibiting the expression shown. Scale bars: 50 μm.
|
