IMAGE

Fig. 4.

ID
ZDB-IMAGE-250324-50
Source
Figures for Gang et al., 2025
Image
Figure Caption

Fig. 4.

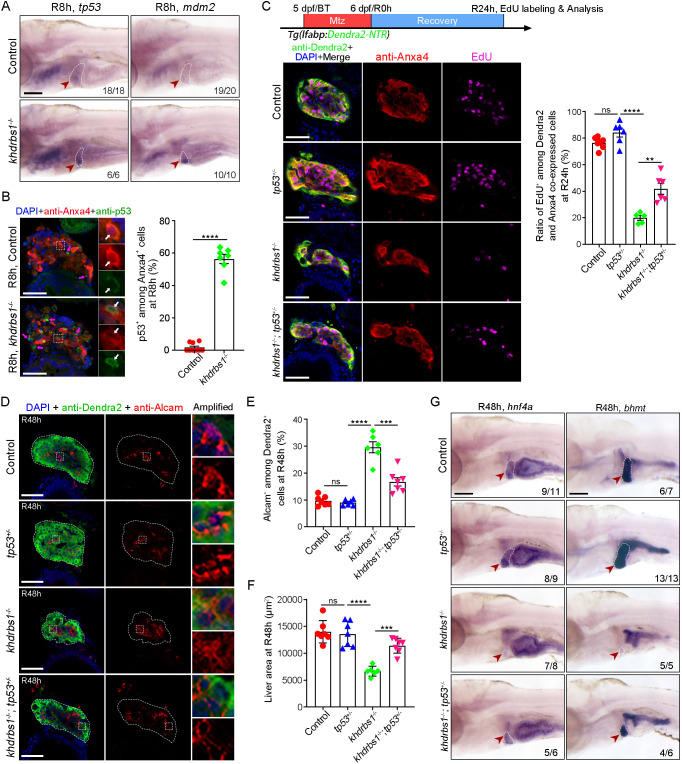
p53 mutation partially rescues liver regeneration in the khdrbs1 mutant. (A) WISH images showing the expression of tp53 and mdm2 in the control and khdrbs1−/− mutant at R8 h. (B) Confocal images and quantification showing the expression of p53 in Anxa4+ cells at R8 h. Insets show magnified views of regions of interest. White arrows point to p53 and Anxa4 co-expressing cells, and magenta arrows point to p53+ and Anxa4 cells. Control, n=9; khdrbs1−/−, n=7. (C) EdU assay (schematic) showing the proliferation of BPPCs after tp53 mutation R24 h. Graph shows quantification of EdU+ among Dendra2 and Anxa4 co-expressing cells. Control, n=7; tp53−/−, n=6; khdrbs1−/−, n=5; khdrbs1−/−;tp53+/−, n=6. (D) Confocal images showing the expression of Alcam and Dendra2 at R48 h. Insets show magnified views of regions of interest. Dashed lines delineate liver region. (E,F) Quantification of Alcam+ cells among Dendra2+ cells (E) or the area of regenerating livers (F) after tp53 mutation at R48 h. Control, n=7; tp53−/−, n=7; khdrbs1−/−, n=6; khdrbs1−/−;tp53+/−, n=7. (G) WISH images showing the expression of hnf4a and bhmt after tp53 mutation at R48 h. Scale bars: 100 μm. In WISH images, red arrowheads and white dashed outlines indicate livers, and numbers indicate the proportion of larvae exhibiting the expression shown. ns, not significant. **P<0.01, ***P<0.001, ****P<0.0001 (two-tailed, unpaired t-test). Error bars represent s.e.m. Scale bars: 100 μm (A); 50 μm (B-D).

Acknowledgments
This image is the copyrighted work of the attributed author or publisher, and ZFIN has permission only to display this image to its users. Additional permissions should be obtained from the applicable author or publisher of the image. Full text @ Development