
|
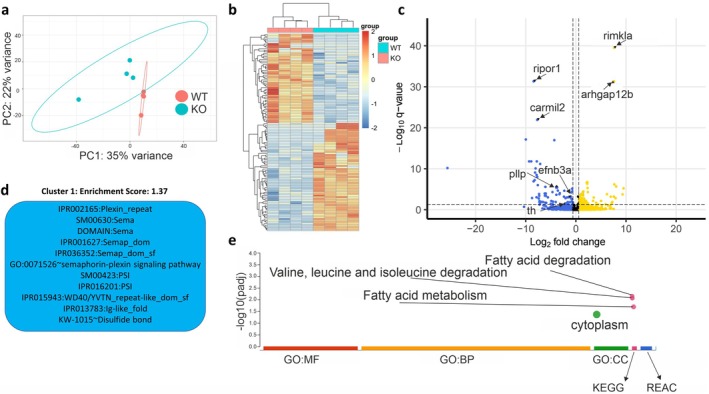
FIGURE 4
Neurotranscriptomic effects of lrrtm4l1 deletion. (a) Principal component analysis plot of the 200 most variable genes after differential expression analysis between lrrtm4l1−/− (KO) and lrrtm4l1+/+ (WT) zebrafish. (b) Heatmap of differentially expressed genes (DEGs;