
- Title
-
Deficiency of the Synaptic Adhesion Protein Leucine-Rich Repeat Transmembrane Protein 4 Like 1 Affects Anxiety and Aggression in Zebrafish
- Authors
- Tatzl, E., Petracco, G., Faimann, I., Balasso, M., Mooslechner, A.A., Bärnthaler, T., Rodriguez-Blanco, G., Reichmann, F.
- Source
- Full text @ Acta Physiol. (Oxf).
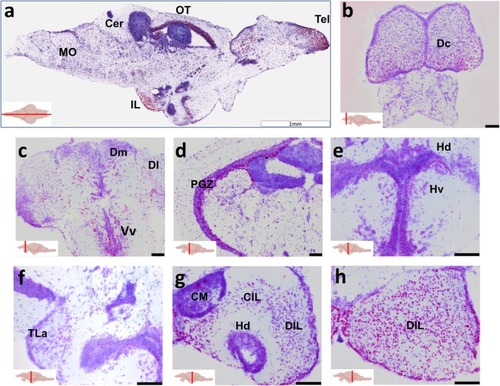
Lrrtm4l1 expression in the adult zebrafish brain. (a) Midsagittal section showing intense lrrtm4l1 expression (purple) in the telencephalon (Tel), inferior lobe (IL) and optic tectum (OT). (b–e) Coronal sections of the telencephalon (b, c), optic tectum (d), hypothalamus (e, f) and inferior lobe (g, h). Sections have been counterstained with thionine acetate for anatomical orientation. Scale bars are 1 mm in (a) and 100 μm in (b–h). The red line in the brain inserts indicates the sectioning plane. Cer, Cerebellum; CIL, central nucleus of the inferior lobe; CM, mamillary bodies; Dc, central zone of the dorsal telencephalon; DIL, diffuse nucleus of the inferior lobe; Dl, lateral zone of the dorsal telencephalon; Dm, Medial zone of the dorsal telencephalon; Hd, dorsal zone of the periventricular hypothalamus; Hv, ventral zone of the periventricular hypothalamus; IL, inferior lobe, MO, medulla oblongata; OT, optic tectum; PGZ, periventricular gray zone of optic tectum; Tel, telencephalon; TLa, torus lateralis; Vv, ventral zone of the ventral telencephalon. Schematic zebrafish brain inserts created by EXPRESSION / LABELING:
|
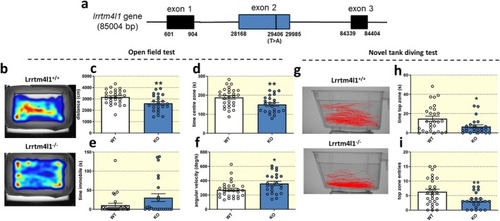
lrrtm4l1−/− zebrafish display heightened anxiety. (a) Schematic representation of the lrrtm4l1 gene. The black line within exon 2 indicates the position of the nonsense mutation of the sa21708 zebrafish mutant line. Numbers represent bp positions. (b) Representative tracking heatmaps of lrrtm4l1+/+ (WT) and lrrtm4l1−/− (KO) zebrafish in the open field test. (c) KO zebrafish swim a shorter distance and (d) spend less time in the centre zone of the open field test. (e) KO animals show no difference in time spent immobile, but (f) display increased angular velocity. (g) Representative swimming trajectories of WT and KO zebrafish in the novel tank diving test. (h) KO zebrafish spend less time in the top zone and (i) enter the top zone of the test tank less frequently. PHENOTYPE:
|
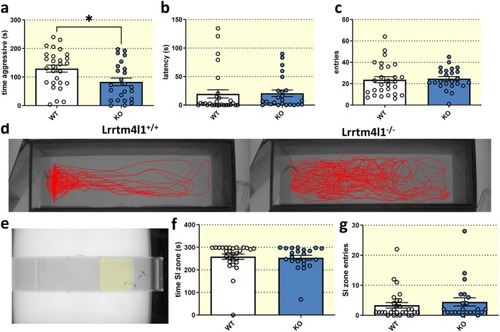
lrrtm4l1−/− zebrafish are less aggressive. (a) Lrrtm4l1−/− (KO) zebrafish were less aggressive than lrrtm4l1+/+ (WT) zebrafish during the mirror‐induced aggression (MIA) assay. (b) The genotype did not alter the latency to approach the mirror and (c) entries into the mirror zone. (d) Representative swimming trajectories of WT and KO zebrafish in the MIA test. (e) Test setup of the corridor social interaction (SI) test showing a test fish approaching the stimulus shoal. The social interaction zone is virtually highlighted in yellow. (f) WT and KO zebrafish spend an equal amount of time in the SI zone and (g) enter the SI zone equally often. PHENOTYPE:
|
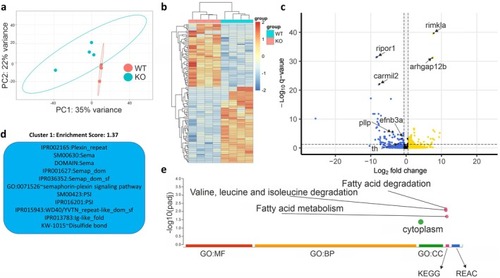
Neurotranscriptomic effects of lrrtm4l1 deletion. (a) Principal component analysis plot of the 200 most variable genes after differential expression analysis between lrrtm4l1−/− (KO) and lrrtm4l1+/+ (WT) zebrafish. (b) Heatmap of differentially expressed genes (DEGs; |

Neurotransmitter and brain metabolome changes in PHENOTYPE:
|