IMAGE

FIGURE 5

ID
ZDB-IMAGE-250407-48
Source
Figures for Tatzl et al., 2025
Image
Figure Caption

FIGURE 5

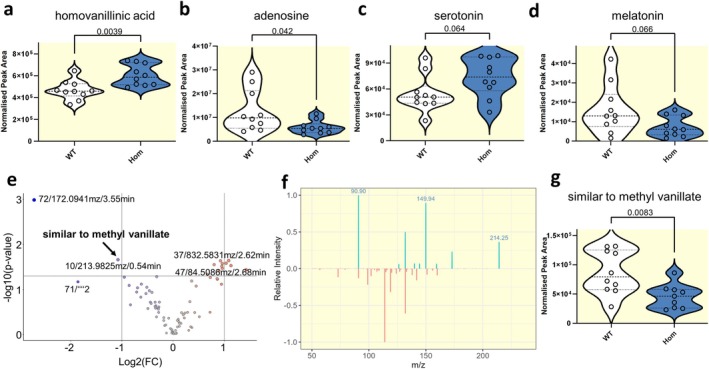
Neurotransmitter and brain metabolome changes in lrrtm4l1−/− zebrafish. Telencephalic levels of (a) homovanillinic acid, (b) adenosine, (c) serotonin and (d) melatonin as measured by targeted metabolomics in lrrtm4l1−/− (Hom) and lrrtm4l1+/+ (WT) zebrafish. n = 10/group. Student's t test. Data are presented as violin plots with the horizontal black line indicating the median. (e) Volcano plot displaying metabolites detected by untargeted metabolomics. Metabolites with adjusted p‐values below 0.05 and a log2fold change ≥ |1| were regarded as significant. (f) Spectral matching of detected metabolites. (g) Violin plot displaying telencephalic levels of a metabolite similar to methyl vanillate. n = 9–10/group.

Figure Data
Acknowledgments
This image is the copyrighted work of the attributed author or publisher, and ZFIN has permission only to display this image to its users. Additional permissions should be obtained from the applicable author or publisher of the image. Full text @ Acta Physiol. (Oxf).