IMAGE

Figure 1

ID
ZDB-IMAGE-250411-17
Source
Figures for Zheng et al., 2025
Image
Figure Caption

Figure 1

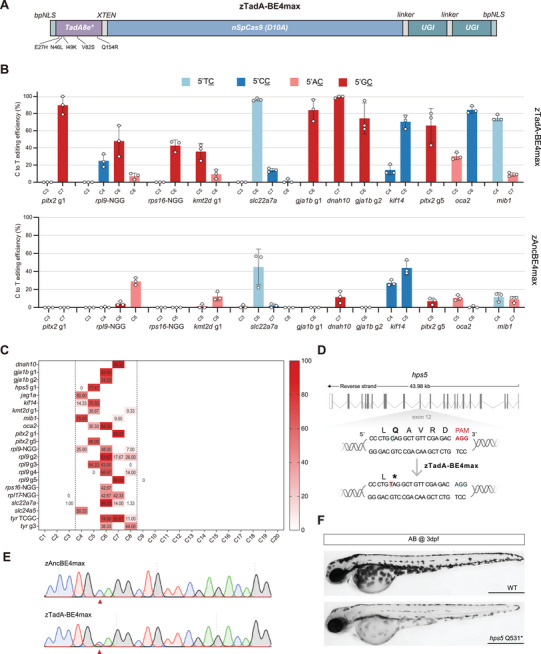
Efficient cytosine base editing in different sequence contexts mediated by zTadA‐BE4max. A) Schematic of the mRNA construct for zTadA‐BE4max. B) Comparison of the editing efficiency between zAncBE4max and zTadA‐BE4max targeting twelve different loci with NGG PAM. C) Summary of editing efficiency of zTadA‐BE4max at twenty‐two NGG PAM sites on fifteen genes. The editing window is outlined by two dashed lines, and the average editing efficiency value for each cytosine locus is shown. D) Schematic diagram of the hps5 Q531* target locus. The targeted sequence is shown with the PAM highlighted in red. The targeted cytosine nucleotide and expected changes are highlighted in green and red, respectively, while the targeted amino acid and expected changes in amino acid are indicated with bold text. E) Comparison of Sanger peak plots for zAncBE4max and zTadA‐BE4max at the hps5 Q531* locus. The red arrowhead indicates the expected nucleotide substitutions. F) Lateral view of 3dpf F1 homozygous embryos with the hps5 (Q531*) mutation (bottom), exhibiting pigmentation defects compared to the wild‐type (top). Scale bar: 500 µm.

Acknowledgments
This image is the copyrighted work of the attributed author or publisher, and ZFIN has permission only to display this image to its users. Additional permissions should be obtained from the applicable author or publisher of the image. Full text @ Adv Sci (Weinh)