IMAGE

FIGURE 1

ID
ZDB-IMAGE-250411-3
Source
Figures for Strachan et al., 2025
Image
Figure Caption

FIGURE 1

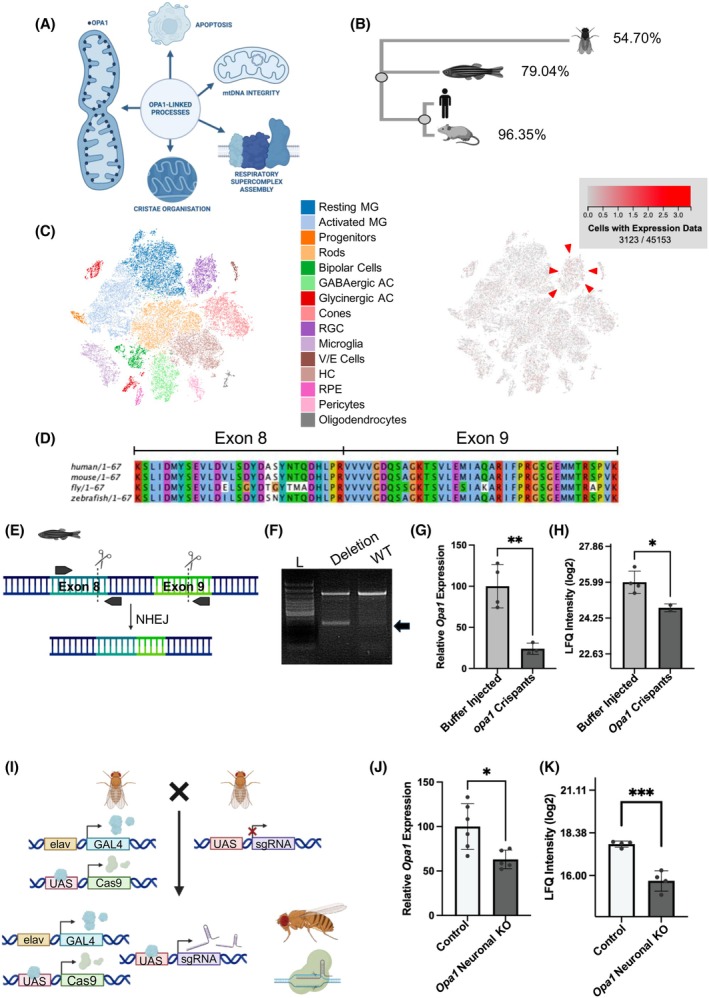
Generation and validation of 2 in vivo models of Opa1 deficiency. (A) Schematic illustrating the localisation and range of functions of Opa1. (B) Dendrogram showing similarity between human, mouse, zebrafish and Drosophila Opa1 proteins generated following Clustal alignment. Percentage identities of the amino acid sequence of OPA1 of the respective model organisms to the canonical isoform of human OPA1 are shown. (C) Expression of opa1 in the zebrafish retina from online scRNA‐seq data https://proteinpaint.stjude.org/F/2019.retina.scRNA.html. Red marks cells with opa1 expression (RGC indicated with red arrowhead). (D) Amino acid sequence of exons 8 and 9 of the Opa1 gene in human, mouse, zebrafish and Drosophila. (E) Schematics illustrating the guide locations of the guide pair (scissors) and PCR primers (arrows) used to generate opa1 editing in zebrafish. (F) A representative PCR genotyping electrophoresis gel from individual larvae injected with opa1 guides with (Deletion) or without (WT) a deletion event. NHEJ produces a deletion band of approximately 350 bp (black arrow). (G, H) Graphs represent mean ± standard deviation (SD) mRNA (G) and protein (H) Opa1 expression in buffer injected controls and opa1 crispant larvae. Statistical analysis consists of two‐tailed t‐tests. n = 3–4. (I) Schematic illustrates the crossing strategy to generate neuronal Opa1 KO Drosophila. (J, K) Graphs represent mean ± standard deviation (SD) mRNA (J) and protein (K) Opa1 expression in progeny of elav‐GAL4.UAS‐Cas9 crossed to either w1118 (control) or Opa1 sgRNA (Opa1 neuronal KO) flies. Statistical analysis consists of two‐tailed t‐tests. n = 4–6.

Acknowledgments
This image is the copyrighted work of the attributed author or publisher, and ZFIN has permission only to display this image to its users. Additional permissions should be obtained from the applicable author or publisher of the image. Full text @ FASEB J.