
- Title
-
Novel in vivo models of autosomal optic atrophy reveal conserved pathological changes in neuronal mitochondrial structure and function
- Authors
- Strachan, E.L., Dillon, E.T., Sullivan, M., Glennon, J.C., Peyrel, A., Sarniguet, J., Dubois, K., Delprat, B., Kennedy, B.N., O'Sullivan, N.C.
- Source
- Full text @ FASEB J.
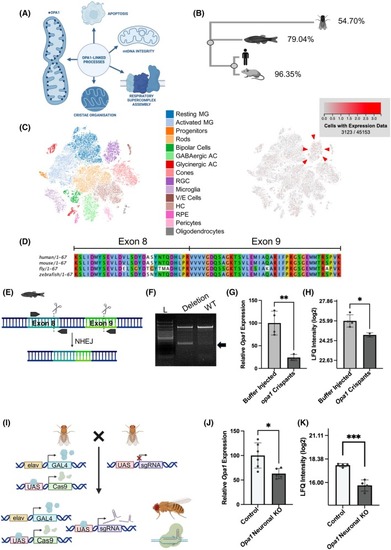
Generation and validation of 2 in vivo models of Opa1 deficiency. (A) Schematic illustrating the localisation and range of functions of Opa1. (B) Dendrogram showing similarity between human, mouse, zebrafish and |
Loss of |
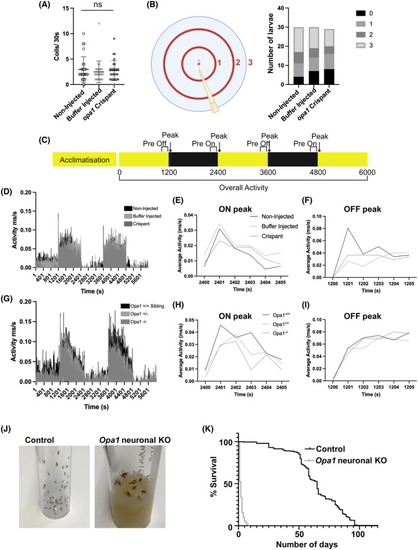
Nonvisual phenotypes in Opa1 deficiency models. (A) Graph represents mean ± standard deviation (SD) number of spontaneous tail coiling movements in 30 s in 24 hpf larvae. No significance (ns) detected by Krustal‐Wallis test. (B) Schematic illustrating the apparatus used for a touch response assay. Graph represents the number of 125 hpf larvae that swim the indicated distance from the starting point in response to a gentle tap on the tail. (C) Schematic illustrating the periods used for activity recording in VMR assays. Black and yellow bars indicate dark and light conditions, respectively. (D–I) Results of VMR assays involving opa1 loss of function zebrafish. No significance was detected by Krustal Wallis test. Activity traces showing activity over the course of an entire VMR assay (100 min) in <131 hpf PHENOTYPE:
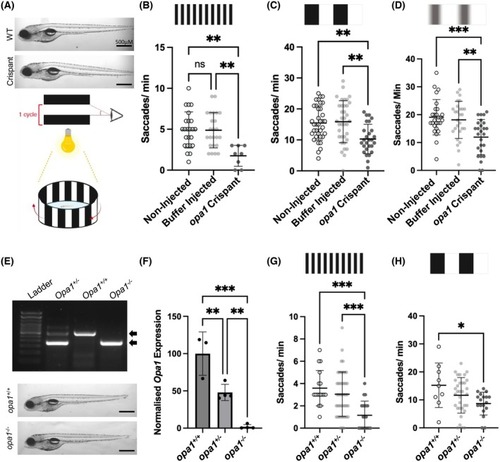
|
Loss of |
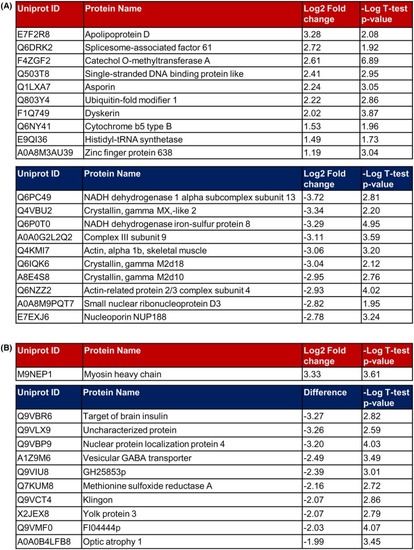
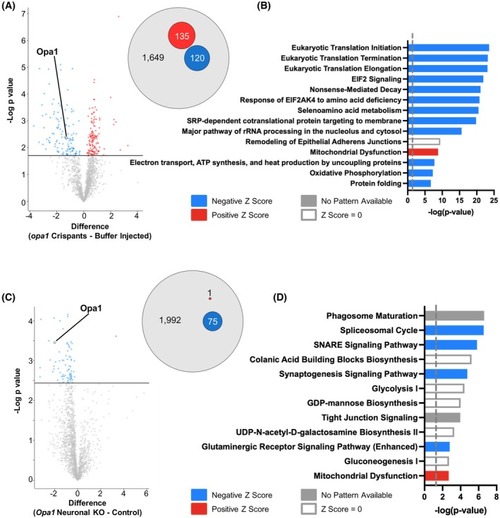
Most significantly altered proteins identified by proteomic profiling in Opa1 loss of function models. (A) Tables show the 10 most up‐ (upper panel) and down‐ (lower panel) regulated proteins in |
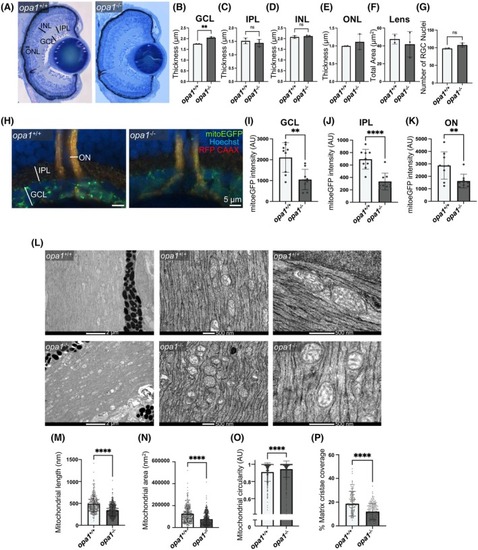
Loss of Opa1 disrupts mitochondrial morphology within RGC axons in zebrafish. (A–F) Cellular lamination is comparable in opa1−/− larvae and opa1+/+ siblings. (A) Representative images of toluidine blue stained retinal sections from <131 hpf zebrafish. Retinal layers indicated. Graphs represent mean ± SD thickness in μm of GCL (B), IPL (C), INL (D), ONL (E) and total area (μm2) of the Lens (F). (G) Graph represents mean ± SD number of RGC nuclei. (H–K) mitoEGFP staining is significantly decreased in |
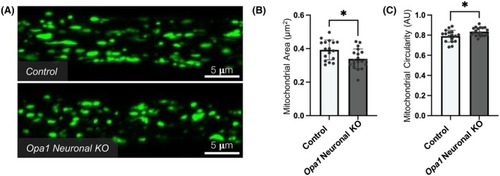
Altered mitochondrial morphology within motor neuron axons in Opa1 neuronal KO |
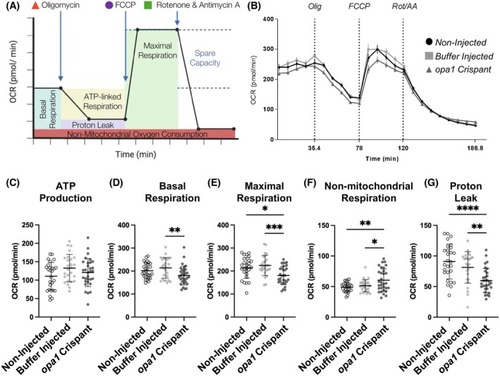
Analysis of mitochondrial respiration in an in vivo model of optic atrophy. (A) Schematic outlining the Mito Stress Test conducted in this study. Oxygen consumption rate (OCR) is measured prior to and following the additions of the ATP synthase inhibitor oligomycin, the uncoupling agent FCCP, and finally the inhibitors of complex I and III, rotenone and antimycin A (respectively). (B) OCR profiles of non‐injected control, buffer injected control, and PHENOTYPE:
|