IMAGE

FIGURE 8

ID
ZDB-IMAGE-250411-9
Source
Figures for Strachan et al., 2025
Image
Figure Caption

FIGURE 8

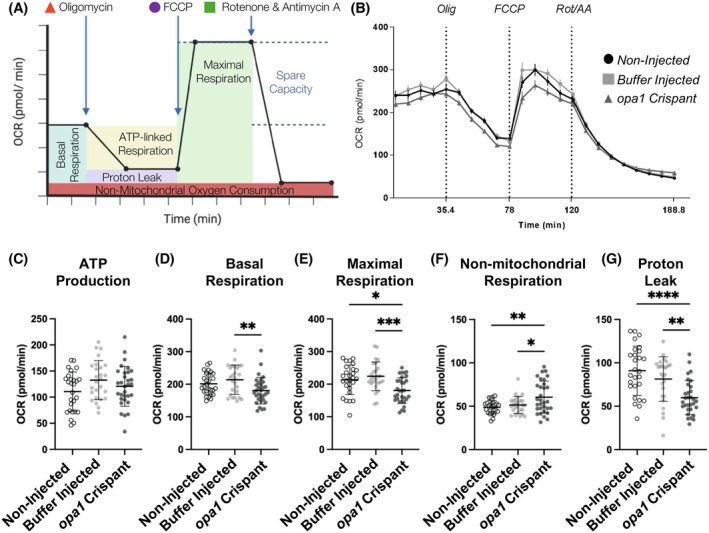
Analysis of mitochondrial respiration in an in vivo model of optic atrophy. (A) Schematic outlining the Mito Stress Test conducted in this study. Oxygen consumption rate (OCR) is measured prior to and following the additions of the ATP synthase inhibitor oligomycin, the uncoupling agent FCCP, and finally the inhibitors of complex I and III, rotenone and antimycin A (respectively). (B) OCR profiles of non‐injected control, buffer injected control, and Opa1 crispant <131 hpf larvae. (C–G) Graphs represent the mean ± SD OCR for the calculated basal respiration (C), ATP production (D), maximal respiration (E), non‐mitochondrial respiration (F) and proton leak (G). Statistical analysis throughout consists of one‐way ANOVA and Tukey's multiple comparisons tests.

Figure Data
Acknowledgments
This image is the copyrighted work of the attributed author or publisher, and ZFIN has permission only to display this image to its users. Additional permissions should be obtained from the applicable author or publisher of the image. Full text @ FASEB J.