
FIGURE 8
- ID
- ZDB-FIG-250411-8
- Publication
- Strachan et al., 2025 - Novel in vivo models of autosomal optic atrophy reveal conserved pathological changes in neuronal mitochondrial structure and function
- Other Figures
- All Figure Page
- Back to All Figure Page
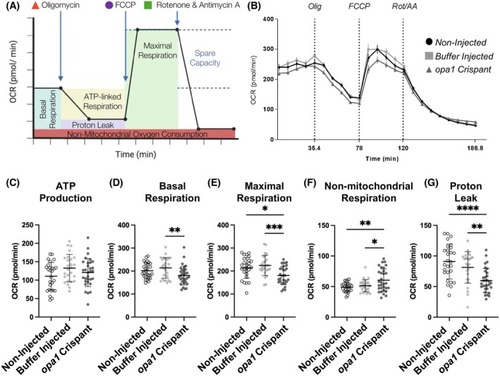
Analysis of mitochondrial respiration in an in vivo model of optic atrophy. (A) Schematic outlining the Mito Stress Test conducted in this study. Oxygen consumption rate (OCR) is measured prior to and following the additions of the ATP synthase inhibitor oligomycin, the uncoupling agent FCCP, and finally the inhibitors of complex I and III, rotenone and antimycin A (respectively). (B) OCR profiles of non‐injected control, buffer injected control, and |
| Fish: | |
|---|---|
| Observed In: | |
| Stage: | Day 4 |