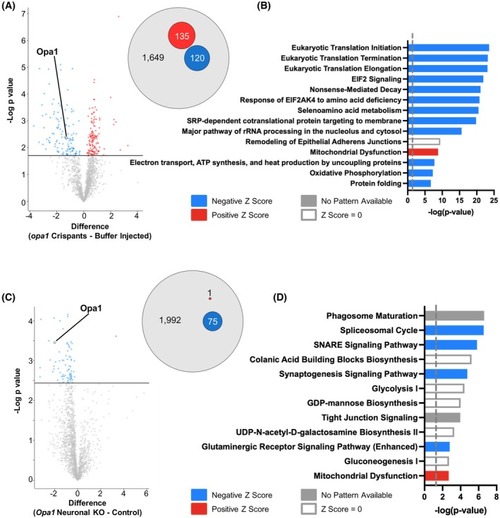
Loss of Opa1 causes disruption of mitochondrial proteins in both Drosophila and zebrafish. (A) Volcano plot depicts the differentially expressed proteins between opa1 crispants and buffer injected controls. The proteins highlighted in red represent the proteins with a Student's t‐test difference ≥0.5. The proteins highlighted in blue represent those with a Student's t‐test difference ≤−0.5. Opa1 is highlighted. Venn diagram (right panel) shows proportion of up‐ (red) and down‐ (blue) regulated proteins between opa1 crispants and buffer injected controls. (B) Ingenuity pathway analysis (IPA) of differentially expressed proteins identified by proteomic analysis of opa1 crispants and buffer injected controls, showing the most enriched pathways identified. (C) Volcano plot depicts the differentially expressed proteins between progeny of elav‐GAL4.UAS‐Cas9 crossed to either w1118 (control) or Opa1 sgRNA (Opa1 neuronal KO) flies. The proteins highlighted in red represent the proteins with a Student's t‐test difference ≥0.5. The proteins highlighted in blue represent those with a Student's t‐test difference ≤−0.5. Opa1 is highlighted. Venn diagram (right panel) shows proportion of up‐ (red) and down‐ (blue) regulated proteins between Opa1 neuronal KO and controls. (D) Ingenuity pathway analysis (IPA) of differentially expressed proteins identified by proteomic analysis of Opa1 neuronal KO and controls, showing the most enriched pathways identified.
|
