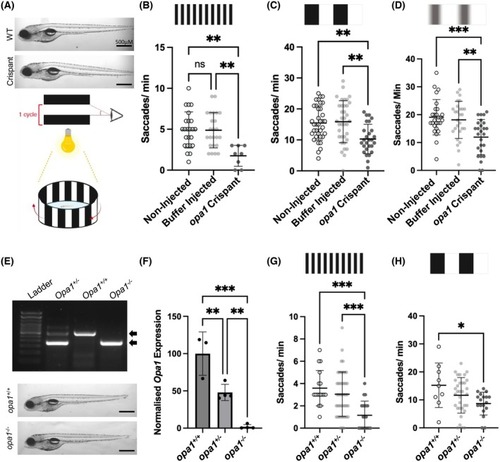
Loss of Opa1 impairs visual function in zebrafish. (A) Schematic of OKR assays which were used to assess visual function in <131 hpf larvae. No gross morphology differences are distinguished between opa1 crispants and buffer injected controls. (B–D) Visual acuity responses of <131 hpf opa1 crispants and controls to drums with 0.2 (B) and 0.02 (C) cycles per degree (cpd) and 0.2 cpd with reduced (20%) black/ white contrast (D). (E) A representative PCR genotyping electrophoresis gel from opa1+/+, opa1+/− and opa1−/− larvae. opa1 mutation produces a 932 bp deletion band. No gross morphological differences were observed between opa1−/− animals and opa1+/+ siblings. (F) qPCR shows a significant reduction of opa1 transcript (normalized to B‐Actin) in both opa1−/− and opa1+/− animals. (G, H) Visual acuity responses of <131 hpf opa1+/+, opa1+/− and opa1−/− larvae to drums with 0.2 (G) and 0.02 (H) cycles per degree. All graphs represent mean ± standard deviation (SD) saccades per minute. Statistical analysis consists of one‐way ANOVA and Tukey's multiple comparisons tests.
|
