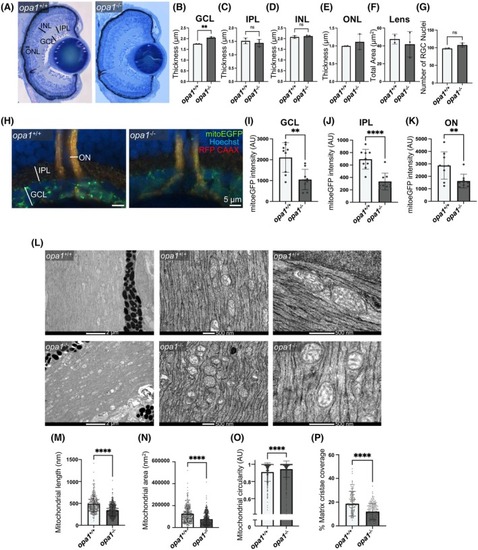
Loss of Opa1 disrupts mitochondrial morphology within RGC axons in zebrafish. (A–F) Cellular lamination is comparable in opa1−/− larvae and opa1+/+ siblings. (A) Representative images of toluidine blue stained retinal sections from <131 hpf zebrafish. Retinal layers indicated. Graphs represent mean ± SD thickness in μm of GCL (B), IPL (C), INL (D), ONL (E) and total area (μm2) of the Lens (F). (G) Graph represents mean ± SD number of RGC nuclei. (H–K) mitoEGFP staining is significantly decreased in opa1−/− larvae compared to opa1+/+ siblings. (H) Representative confocal image of wholemount retinas of <131 hpf Tg(isl2b:MitoeGFP‐2ATagRFPCAAX) zebrafish. Graphs represent mean ± standard deviation (SD) mitoEGFP intensity within the GCL (I), IPL (J) and ON (K). Statistical analysis throughout consists of two‐tailed t‐tests. (L–P) Mitochondrial organization is significantly disrupted in opa1−/− larvae compared to opa1+/+ siblings. (L) Representative electron microscopic images of the optic nerve of <131 hpf larval zebrafish. Graphs represent mean ± SD length of longest mitochondrial axis (M), total mitochondrial area (N) mitochondrial circularity (O) and % mitochondrial matrix occupied by cristae (P). Graphs show data from individual mitochondria with statistical analysis performed by Mann Whitney tests (n = 226–345).
|
