
Image
|
Figure Caption
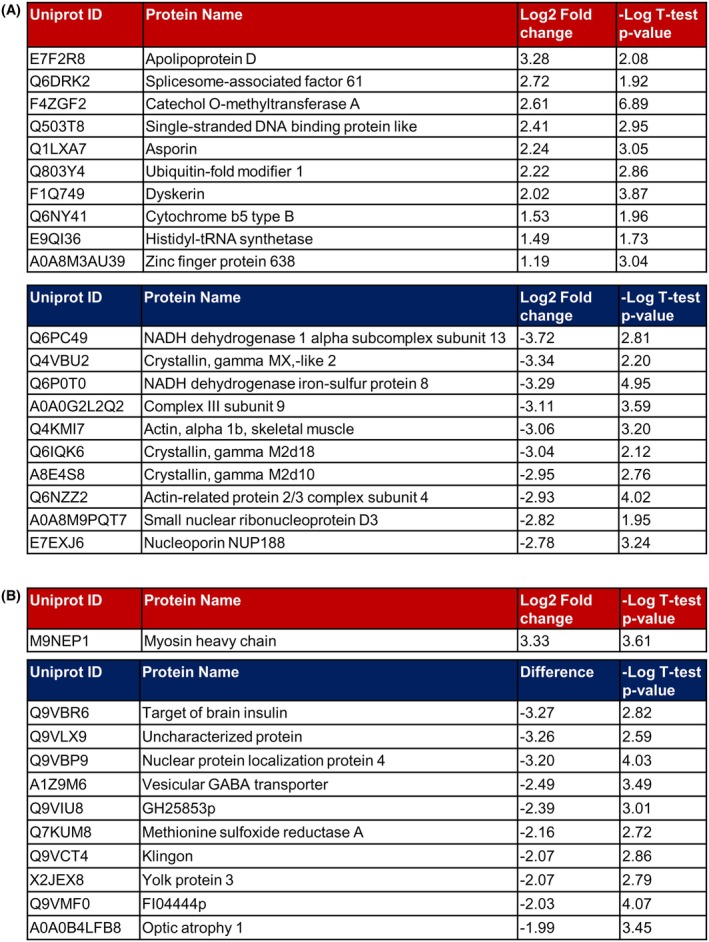
FIGURE 5
Most significantly altered proteins identified by proteomic profiling in Opa1 loss of function models. (A) Tables show the 10 most up‐ (upper panel) and down‐ (lower panel) regulated proteins in
Acknowledgments
This image is the copyrighted work of the attributed author or publisher, and
ZFIN has permission only to display this image to its users.
Additional permissions should be obtained from the applicable author or publisher of the image.
Full text @ FASEB J.