
|
FIGURE 3
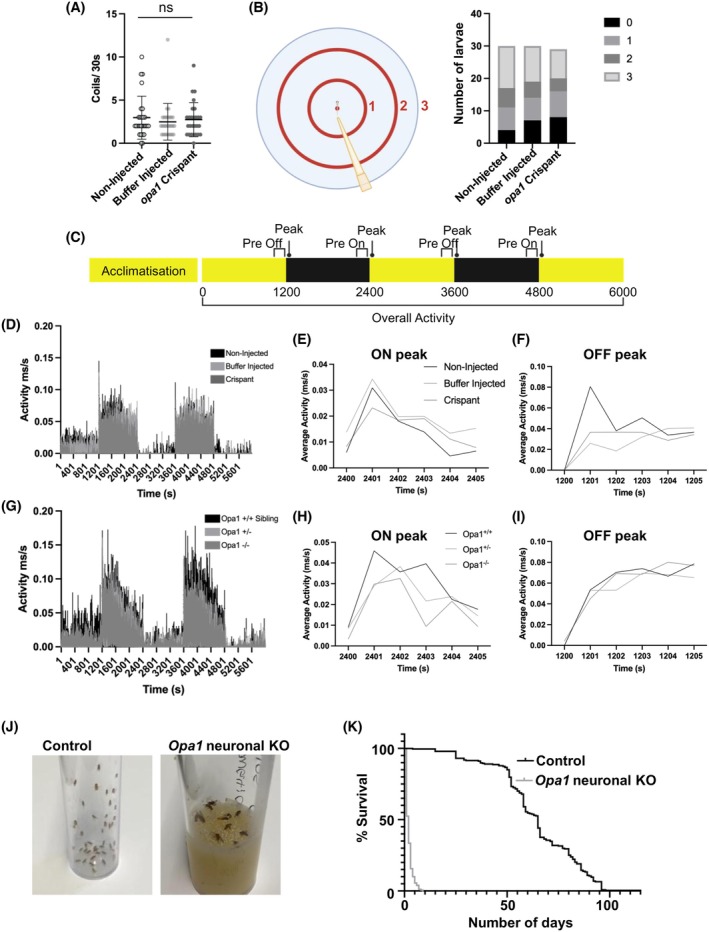
Nonvisual phenotypes in Opa1 deficiency models. (A) Graph represents mean ± standard deviation (SD) number of spontaneous tail coiling movements in 30 s in 24 hpf larvae. No significance (ns) detected by Krustal‐Wallis test. (B) Schematic illustrating the apparatus used for a touch response assay. Graph represents the number of 125 hpf larvae that swim the indicated distance from the starting point in response to a gentle tap on the tail. (C) Schematic illustrating the periods used for activity recording in VMR assays. Black and yellow bars indicate dark and light conditions, respectively. (D–I) Results of VMR assays involving opa1 loss of function zebrafish. No significance was detected by Krustal Wallis test. Activity traces showing activity over the course of an entire VMR assay (100 min) in <131 hpf