
|
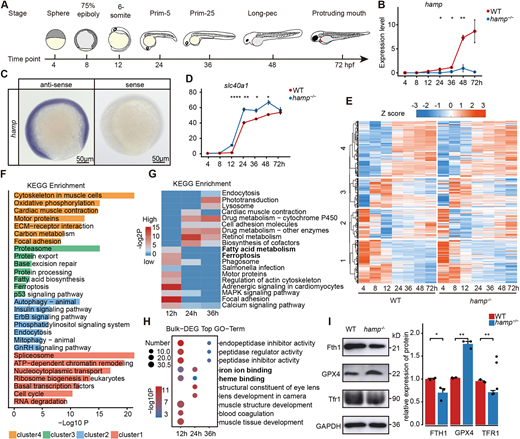
Fig. 2 Elevated ferroptosis during the embryonic hematopoietic process in the hamp−/− zebrafish. (A) Transcriptomes were collected from zebrafish embryos at seven developmental stages spanning 4-72 h post-fertilization (hpf). (B) Expression profile of the hamp in zebrafish embryos from 4 hpf to 72 hpf (n=3, unpaired, two-tailed Student's t-test). (C) Expression of hamp at 12 hpf in zebrafish embryos examined by whole-mount in situ hybridization. (D) Expression profile of ferroportin in wild type and hamp−/− from 4 hpf to 72 hpf (n=3, unpaired, two-tailed Student's t-test). (E) K-means clustering analysis of wild type and hamp−/−. (F) KEGG enrichment analysis of four clusters. (G) KEGG enrichment analysis of DEGs at 12 hpf, 24 hpf and 36 hpf. (H) GO enrichment analysis of DEGs at 12 hpf, 24 hpf and 36 hpf. (I) Protein expression levels and grayscale analysis of FTH1, GPX4 and TFR1 (n=3, unpaired, two-tailed Student's t-test). Data are mean±s.e.m. *P<0.05, **P<0.01, ****P<0.0001.