
- Title
-
Hepcidin deletion disrupts iron homeostasis and hematopoiesis in zebrafish embryogenesis
- Authors
- Yang, W., Peng, M., Wang, Y., Zhang, X., Li, W., Zhai, X., Wu, Z., Hu, P., Chen, L.
- Source
- Full text @ Development
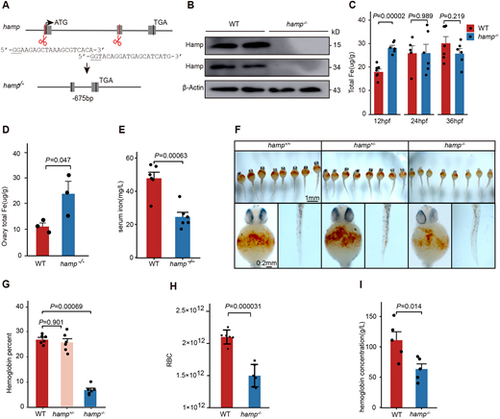
Deletion of the zebrafish hamp gene reduces hemoglobin synthesis during the embryonic period. (A) Schematic of the targeting site in hamp and the resulting nucleotide sequence in the mutant. (B) Hamp protein level in the wild-type and hamp−/− embryos detected using anti-Hamp antibody. (C) Total iron content of wild-type and hamp−/− embryos at 12 hpf, 24 hpf and 36 hpf (n=6, unpaired, two-tailed Student's t-test). (D) Total iron content of wild-type and hamp−/− ovaries (n=3, unpaired two-tailed Student's t-test). (E) Serum iron of wild-type and hamp−/− peripheral blood (n=6, unpaired, two-tailed Student's t-test). (F) O-Dianisidine staining of functional hemoglobin in the mature primitive erythrocytes in wild type (left), hamp+/− (middle) and hamp−/− (right) at 36 hpf. (G) The hemoglobin levels of embryos was significantly reduced in hamp−/− compared with wild type at 36 hpf (n=6, unpaired, two-tailed Student's t-test). (H) The number of erythrocytes was significantly reduced in hamp−/− compared with wild type at 8 mpf (n=6, unpaired, two-tailed Student's t-test). (I) Hemoglobin concentration was significantly reduced in hamp−/− compared with wild type in adult peripheral blood (n=5, unpaired, two-tailed Student's t-test). Data are mean±s.e.m. |
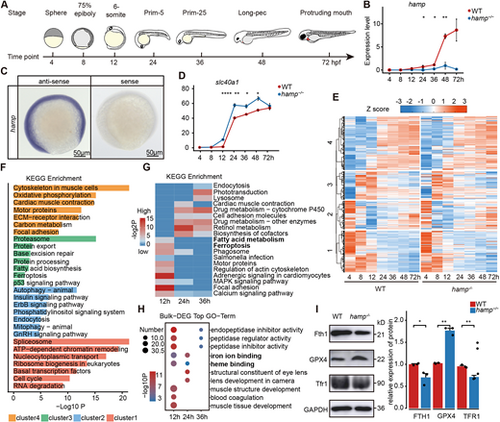
Elevated ferroptosis during the embryonic hematopoietic process in the hamp−/− zebrafish. (A) Transcriptomes were collected from zebrafish embryos at seven developmental stages spanning 4-72 h post-fertilization (hpf). (B) Expression profile of the hamp in zebrafish embryos from 4 hpf to 72 hpf (n=3, unpaired, two-tailed Student's t-test). (C) Expression of hamp at 12 hpf in zebrafish embryos examined by whole-mount in situ hybridization. (D) Expression profile of ferroportin in wild type and hamp−/− from 4 hpf to 72 hpf (n=3, unpaired, two-tailed Student's t-test). (E) K-means clustering analysis of wild type and hamp−/−. (F) KEGG enrichment analysis of four clusters. (G) KEGG enrichment analysis of DEGs at 12 hpf, 24 hpf and 36 hpf. (H) GO enrichment analysis of DEGs at 12 hpf, 24 hpf and 36 hpf. (I) Protein expression levels and grayscale analysis of FTH1, GPX4 and TFR1 (n=3, unpaired, two-tailed Student's t-test). Data are mean±s.e.m. *P<0.05, **P<0.01, ****P<0.0001. |
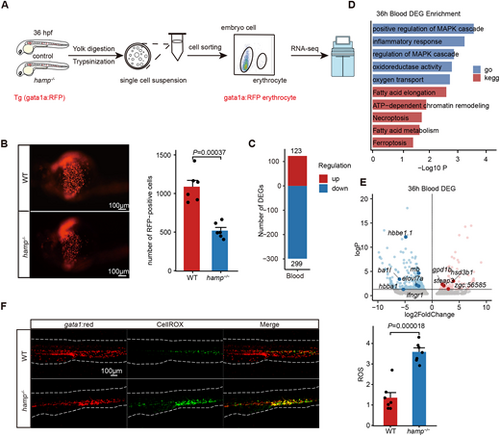
Erythroid cells in hamp−/− zebrafish embryos undergo ferroptosis at 36 hpf. (A) Schematic workflow for the red blood cells with fluorescent probe at 36 hpf. (B) Fluorescent images and quantitation of gata1-positive erythrocytes indicated that hamp−/− have fewer gata1a-positive erythrocytes at 36 hpf (n=6, unpaired, two-tailed Student's t-test). (C) The number of DEGs in the blood cells of 36 hpf zebrafish embryos. (D) Enrichment analysis of DEGs in blood cells of 36 hpf zebrafish embryos. (E) DEGs of blood cells at 36 hpf. (F) Detection and quantification of ROS in whole embryos of 36 hpf zebrafish embryos. Confocal imaging shows the colocalization of gata1:red+ and CellROX+ cells (n=7, unpaired, two-tailed Student's t-test). |
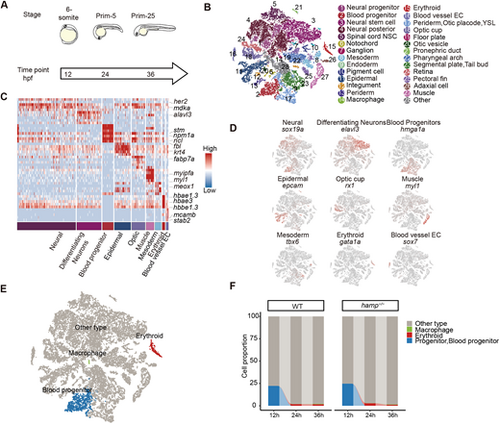
Single-cell resolution study of altered hematopoiesis in hamp−/− zebrafish embryos. (A) Single-cell transcriptomes were collected from zebrafish embryos at three time points. (B) UMAP plot showing 28 embryo cell clusters across three developmental stages. Cells are colored by their cell-type annotation and numbered according to the legend beside. (C) Cell cluster annotation and marker heatmap. (D) UMAP visualization of the expression of curated feature genes for cell-type identification. (E) UMAP plot showing three embryo cell clusters related to hematopoiesis, including erythroid, macrophage and blood progenitor. (F) The proportion of different groups of cells in zebrafish embryos at 12 hpf, 24 hpf and 36 hpf. |
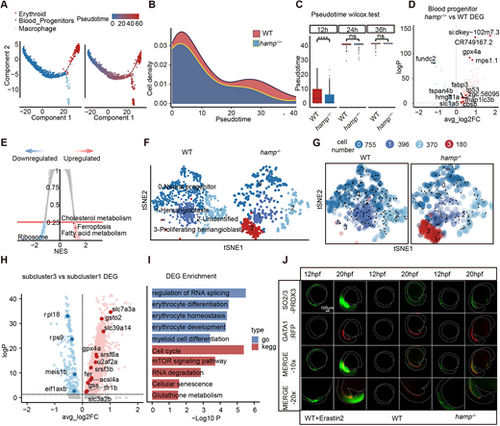
Ferroptosis causes specific developmental delay of blood progenitor cells. (A-C) Pseudotemporal analysis of zebrafish blood progenitor cells, erythrocytes and macrophages. (D) Expression of genes related to iron metabolism in blood progenitor cells. (E) Analysis of KEGG enrichment for differentially expressed genes in blood progenitor cells. (F) Subgroup analysis of zebrafish embryos at 12 hpf. (G) Pseudotemporal analysis of sub-cluster groups of blood progenitor cells. (H) EDGs in subcluster 3 related to RNA splicing, mTOR signaling pathway and glutathione metabolism. (I) GO and KEGG enrichment analysis of EDGs in subcluster 3. (J) Immunofluorescence of ferroptosis marker-SO2/3-PRDX3 zebrafish embryos at 12 hpf and 20 hpf. |