
|
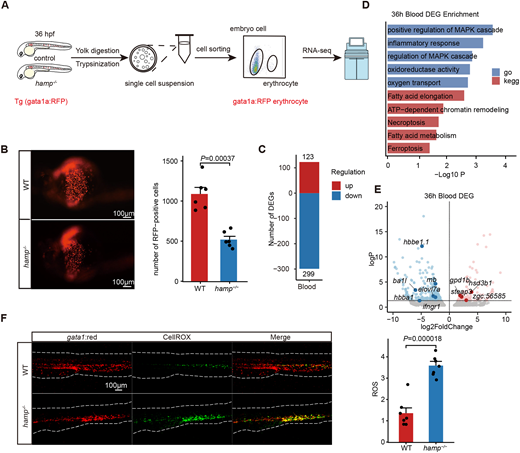
Fig. 3 Erythroid cells in hamp−/− zebrafish embryos undergo ferroptosis at 36 hpf. (A) Schematic workflow for the red blood cells with fluorescent probe at 36 hpf. (B) Fluorescent images and quantitation of gata1-positive erythrocytes indicated that hamp−/− have fewer gata1a-positive erythrocytes at 36 hpf (n=6, unpaired, two-tailed Student's t-test). (C) The number of DEGs in the blood cells of 36 hpf zebrafish embryos. (D) Enrichment analysis of DEGs in blood cells of 36 hpf zebrafish embryos. (E) DEGs of blood cells at 36 hpf. (F) Detection and quantification of ROS in whole embryos of 36 hpf zebrafish embryos. Confocal imaging shows the colocalization of gata1:red+ and CellROX+ cells (n=7, unpaired, two-tailed Student's t-test).