
Fig. 4
- ID
- ZDB-FIG-250505-49
- Publication
- Yang et al., 2025 - Hepcidin deletion disrupts iron homeostasis and hematopoiesis in zebrafish embryogenesis
- Other Figures
- All Figure Page
- Back to All Figure Page
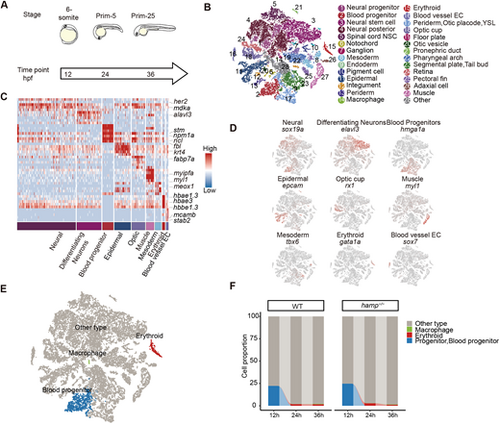
Single-cell resolution study of altered hematopoiesis in hamp−/− zebrafish embryos. (A) Single-cell transcriptomes were collected from zebrafish embryos at three time points. (B) UMAP plot showing 28 embryo cell clusters across three developmental stages. Cells are colored by their cell-type annotation and numbered according to the legend beside. (C) Cell cluster annotation and marker heatmap. (D) UMAP visualization of the expression of curated feature genes for cell-type identification. (E) UMAP plot showing three embryo cell clusters related to hematopoiesis, including erythroid, macrophage and blood progenitor. (F) The proportion of different groups of cells in zebrafish embryos at 12 hpf, 24 hpf and 36 hpf. |