IMAGE

Fig. 4

ID
ZDB-IMAGE-250521-40
Source
Figures for Þorsteinsson et al., 2025
Image
Figure Caption

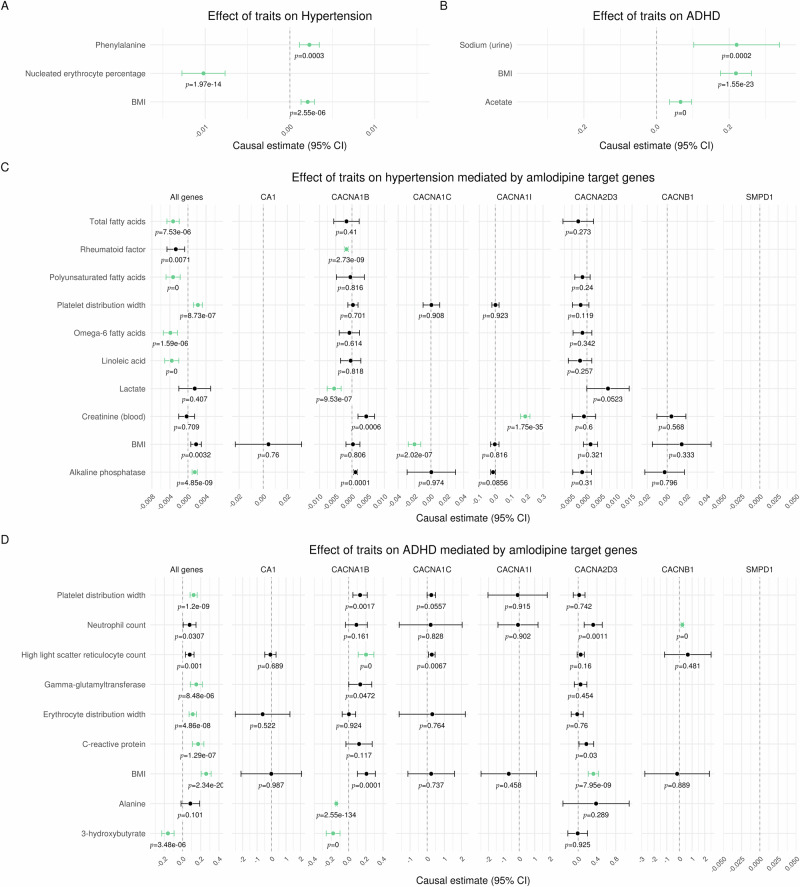
Fig. 4 Genome-wide and drug-target Mendelian randomization.

A Only exposures with significant effects for hypertension are shown. The significance threshold was Bonferroni corrected for multiple testing of 140 traits (p < α/n = 0.05/140). Green dots indicate a significant effect without pleiotropy. Estimates are scaled per 1-standard deviation (SD) increase in the respective exposure trait, i.e., every 1-SD higher genetically proxied trait level was associated with the respective change in log odds ratio for ADHD. B Only exposures with significant effect estimates for ADHD are shown. The significance threshold was Bonferroni corrected for multiple testing of 140 traits (p < α/n = 0.05/140). Green dots indicate a significant effect without pleiotropy. Estimates are scaled per 1-standard deviation (SD) increase in the respective exposure trait, i.e., every 1-SD higher genetically proxied trait level was associated with the respective increase in log odds ratio for hypertension. C Only exposures which had significant effects for hypertension mediated by one of the eight groups of genes are reported. The significance threshold was Bonferroni corrected for multiple testing of 140 traits and 8 gene selections (p < α/n = 0.05/140/8). Green dots indicate a significant effect without pleiotropy. Estimates are scaled per 1-standard deviation (SD) increase in the respective exposure trait, i.e., every 1-SD higher genetically proxied trait level was associated with the respective decrease in log odds ratio for hypertension. D Only exposures which had significant causal effects for ADHD mediated by one of the eight groups of genes are reported. The significance threshold was Bonferroni corrected for multiple testing of 140 traits and 8 gene selections (p < α/n = 0.05/140/8). Green dots indicate a significant causal effect without pleiotropy. Estimates are scaled per 1-standard deviation (SD) increase in the respective exposure trait, i.e., every 1-SD higher genetically proxied trait level was associated with the respective increase in log odds ratio for ADHD.

Acknowledgments
This image is the copyrighted work of the attributed author or publisher, and ZFIN has permission only to display this image to its users. Additional permissions should be obtained from the applicable author or publisher of the image. Full text @ Neuropsychopharmacology