
- Title
-
Validation of L-type calcium channel blocker amlodipine as a novel ADHD treatment through cross-species analysis, drug-target Mendelian randomization, and clinical evidence from medical records
- Authors
- Þorsteinsson, H., Baukmann, H.A., Sveinsdóttir, H.S., Halldórsdóttir, D.Þ., Grzymala, B., Hillman, C., Rolfe-Tarrant, J., Parker, M.O., Cope, J.L., Ravarani, C.N.J., Schmidt, M.F., Karlsson, K.Æ.
- Source
- Full text @ Neuropsychopharmacology
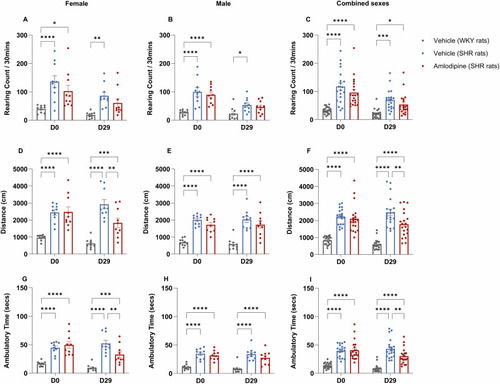
Effect of amlodipine on Open Field Behavior in SHR rats. SHR rats were treated with either amlodipine (10 mg/kg) or a vehicle daily for 30 days; WKY rats received vehicle only. Assessments were made before treatment (D0) and at end of treatment (D29) using OFT. Measurements included rearing frequency ( |
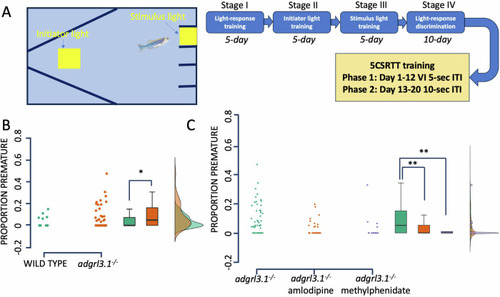
Acute effects of amlodipine and methylphenidate on impulsivity in adult zebrafish. PHENOTYPE:
|
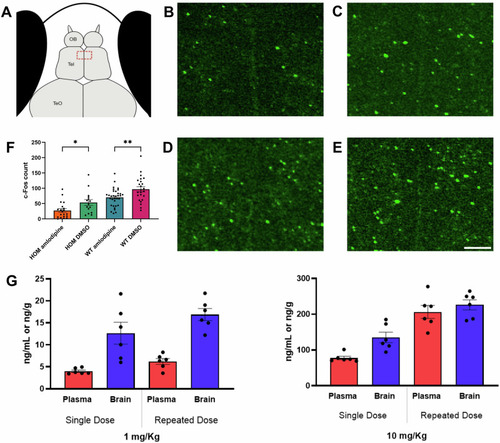
c-Fos expression in |
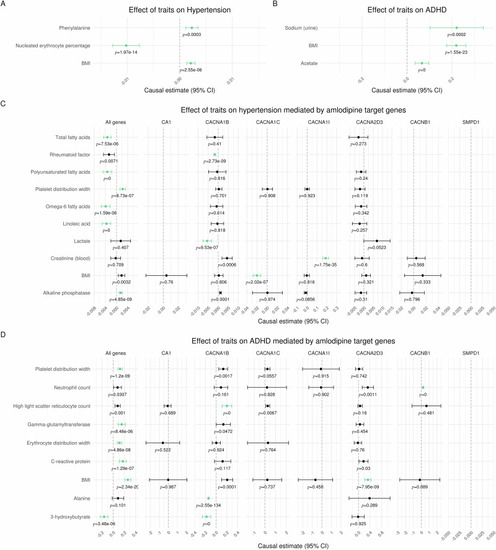
Genome-wide and drug-target Mendelian randomization. |
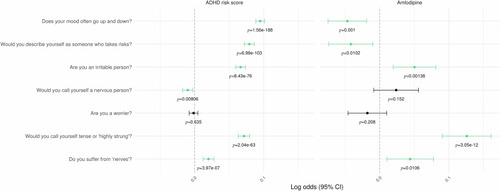
UK Biobank mental health questionnaire responses as functions of ADHD risk score and amlodipine prescription status. Each row represents a logistic regression model where UK Biobank participants’ responses to the question in the left-hand column are modeled as functions of ADHD risk score and amlodipine prescription status. The points plotted in the center and right-hand columns are the coefficient estimates for these two predictors with their corresponding |