|
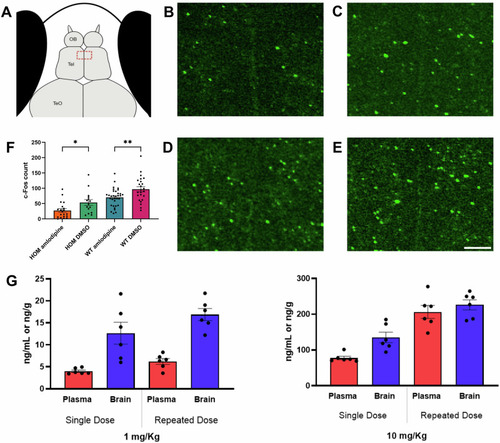
c-Fos expression in adgrl3.1−/− zebrafish in the telencephalon following amlodipine exposure. A schematic representation of a 6 dpf zebrafish larva, red dashed rectangle within the telencephalon denotes the area used for counting. Representative figures of immunohistochemically labeled c-Fos of adgrl3.1−/− zebrafish larvae treated with (B) 10 µM amlodipine and (C) 0.1% DMSO and WT zebrafish larvae treated with (D) 10 µM amlodipine and (E) 0.1% DMSO. F c-Fos count for each group. Data are depicted as mean ± SEM, n = 20, one-way ANOVA followed by Tukey’s multiple comparisons test, *P ≤ 0.05, **P ≤ 0.01, (scale bar = 10 µm). G levels of amlodipine in brain and plasma following 1 or 10 mg/kg oral dose after single or 5-day doses in rats.
|