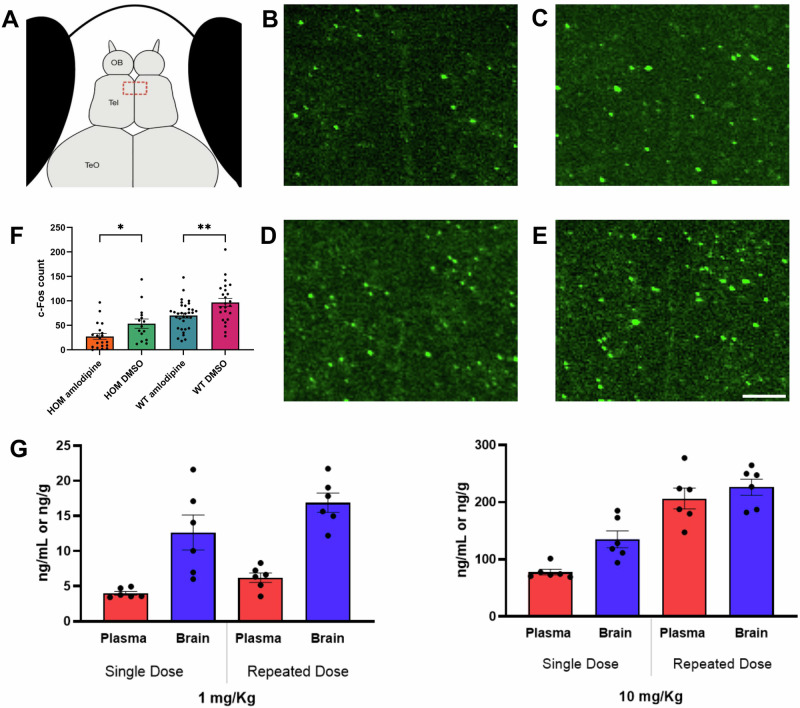
IMAGE

Fig. 3

ID
ZDB-IMAGE-250521-39
Antibodies
Source
Figures for Þorsteinsson et al., 2025
Image
Figure Caption

Fig. 3 c-Fos expression in adgrl3.1−/− zebrafish in the telencephalon following amlodipine exposure.

A schematic representation of a 6 dpf zebrafish larva, red dashed rectangle within the telencephalon denotes the area used for counting. Representative figures of immunohistochemically labeled c-Fos of adgrl3.1−/− zebrafish larvae treated with (B) 10 µM amlodipine and (C) 0.1% DMSO and WT zebrafish larvae treated with (D) 10 µM amlodipine and (E) 0.1% DMSO. F c-Fos count for each group. Data are depicted as mean ± SEM, n = 20, one-way ANOVA followed by Tukey’s multiple comparisons test, *P ≤ 0.05, **P ≤ 0.01, (scale bar = 10 µm). G levels of amlodipine in brain and plasma following 1 or 10 mg/kg oral dose after single or 5-day doses in rats.

Figure Data
Acknowledgments
This image is the copyrighted work of the attributed author or publisher, and ZFIN has permission only to display this image to its users. Additional permissions should be obtained from the applicable author or publisher of the image. Full text @ Neuropsychopharmacology