
|
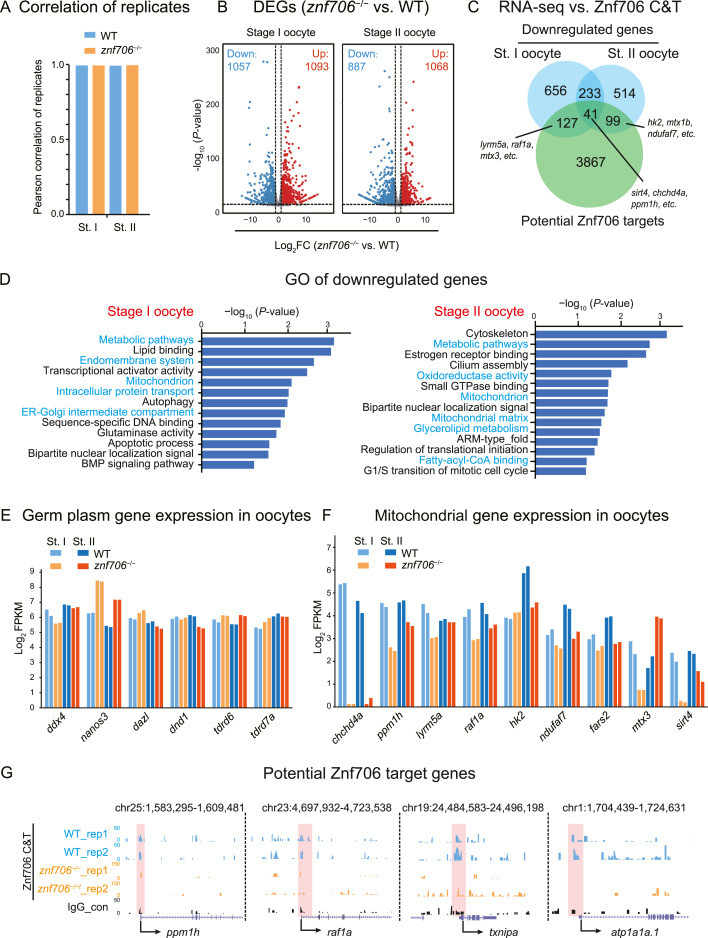
Fig. 6 Transcriptome analysis of WT and znf706−/− oocytes. A: Bar graph showing the correlations between two biological replicates of WT and znf706−/− oocytes at stages I and II. B: Volcano plots illustrating gene expression changes between WT and znf706−/− oocytes at stages I and II. Red, upregulated genes; Blue, downregulated genes. C: Venn diagram illustrating the overlap between potential Znf706 target genes identified with either promoter (±2 kb of transcription start site) or distal peaks (around ±250 kb of distal peaks) by CUT&Tag and downregulated genes in znf706−/− oocytes by RNA-seq. D: Bar plots showing GO analysis of downregulated genes in znf706−/− oocytes at stages I (left) and II (right). E and F: Bar plots showing the expression levels of germ plasm genes (E) and mitochondrial genes (F) of WT (blue) and znf706−/− (orange) oocytes at stages I and II by RNA-seq. G: UCSC Genome Browser snapshots showing Znf706 and IgG peaks at promoter regions of ppm1h, raf1a, txnipa, and atp1a1a.1. Pink shadows indicated promoter regions. WT, wild-type; st., stage; C&T, CUT&Tag.
Reprinted from Journal of genetics and genomics = Yi chuan xue bao, 52, Zhang, W., Li, Y., Li, H., Liu, X., Zheng, T., Li, G., Liu, B., Lv, T., Wei, Z., Xing, C., Jia, S., Meng, A., Wu, X., Znf706 regulates germ plasm assembly and primordial germ cell development in zebrafish, 666-679, Copyright (2024) with permission from Elsevier. Full text @ J. Genet. Genomics