
- Title
-
Znf706 regulates germ plasm assembly and primordial germ cell development in zebrafish
- Authors
- Zhang, W., Li, Y., Li, H., Liu, X., Zheng, T., Li, G., Liu, B., Lv, T., Wei, Z., Xing, C., Jia, S., Meng, A., Wu, X.
- Source
- Full text @ J. Genet. Genomics
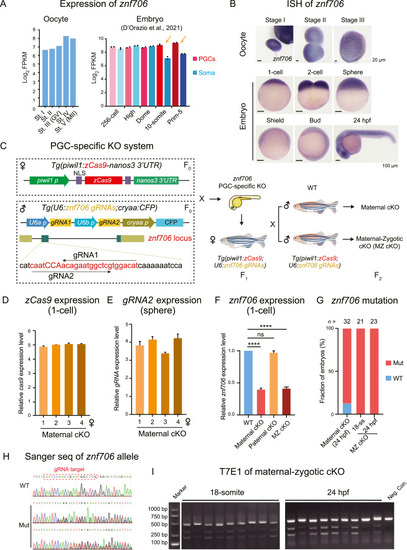
Generation of znf706 conditional knockout mutants by double transgenic system. A: Bar plots showing expression levels of znf706 in WT oocytes (Zhang et al., 2018), PGCs, and somatic cells in embryos (D'Orazio et al., 2021). B: ISH of znf706 showing znf706 expression patterns during oogenesis and early embryonic developmental stages. C: Left, schematic diagram of generation of Tg(piwil1:zCas9;U6:znf706 gRNAs) double transgenic system. The target sites of gRNA1 and gRNA2 at the znf706 locus were also delineated. Right, schematic diagram of generation of maternal cKO and MZ cKO mutants. D and E: Relative expression levels of zCas9 (D) and gRNA2 (E) in maternal cKO embryos derived from four Tg(piwil1:zCas9;U6:znf706 gRNAs) females detected by qRT-PCR assay. F: Relative expression levels of znf706 in WT, maternal cKO, paternal cKO, and MZ cKO embryos at 1-cell stage, detected by qRT-PCR. ns, not significant; ∗∗∗∗, P < 0.0001. G: Bar plot showing the fraction of WT embryos (WT, blue) and embryos containing mutated znf706 alleles (Mut, red) in maternal cKO and MZ cKO embryos at indicated stages. H: Sanger sequencing of znf706 alleles in WT and embryos containing mutated znf706 alleles in (G). The gRNA target site was indicated by the red dashed box. I: Examination of znf706 mutant alleles in MZ cKO embryos at 18-somite and 24 hpf by T7E1 assay. Genomic DNAs extracted from WT embryos acted as Neg. Con. FPKM, fragments per kilobase of exon per million fragments mapped; st., stage; ISH, in situ hybridization; MZ, maternal-zygotic; cKO, conditional knockout; WT, wild-type; Mut, mutant; hpf, hours post fertilization; T7E1, T7 endonuclease I; Marker, DNA markers; Neg. Con., negative control. Scales bars, 20 μm (B, upper); 100 μm (B, lower). |
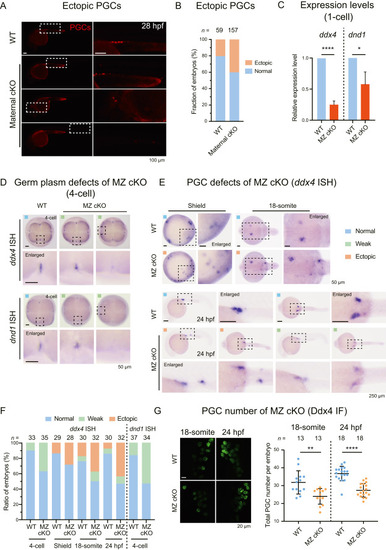
Defective PGC development in znf706 maternal and maternal-zygotic cKO mutants. A: Representative pictures of WT and Tg(piwil1:zCas9;ca15b:mCherry;U6:znf706 gRNAs) embryos at 28 hpf showing PGC positions labeled by mCherry. B: Bar plot showing the ratio of WT and maternal cKO embryos at 28 hpf containing ectopic PGCs (ectopic, orange) or without ectopic PGCs (normal, blue). C: Bar plot showing qRT-PCR analysis of ddx4 and dnd1 mRNAs in WT and znf706 MZ cKO mutant embryos at 1-cell stage. D: ISH of ddx4 (upper) and dnd1 (lower) showing germ plasm distribution in WT and znf706 MZ cKO mutant embryos at 4-cell stage. The dashed boxed areas were enlarged for better viewing. E: ISH of ddx4 revealing PGCs in WT and znf706 MZ cKO mutant embryos at shield, 18-somite, and 24 hpf stages. The dashed boxed areas were enlarged for better viewing. F: Histogram showing the proportion of embryos in (D) and (E) with normal (blue), impaired ddx4 signal (green), and ectopically located PGCs (orange) at indicated stages. Blue square represented embryos with normal PGC number and proper location (D–F); green square for embryos with reduced ddx4 signal (D–F); orange square for embryos with at least one ectopic PGC location (E–F). G: Immunostaining of Ddx4 showing PGCs in WT and znf706 MZ cKO embryos (left) at 18-somite and 24 hpf stages. Scatter plots (right) illustrating the discrepancy in PGC counts. Scales bars, 100 μm (A); 50 μm (D, shield and 18-somite stages in E); 250 μm (24 hpf in E); 20 μm (G). n, number of embryos. ∗∗∗∗, P < 0.0001; ∗∗, P < 0.01; ∗, P < 0.05. cKO, conditional knockout; MZ, maternal-zygotic; PGCs, primordial germ cells; WT, wild-type; ISH, in situ hybridization; IF, immunofluorescence staining; hpf, hours post fertilization. |
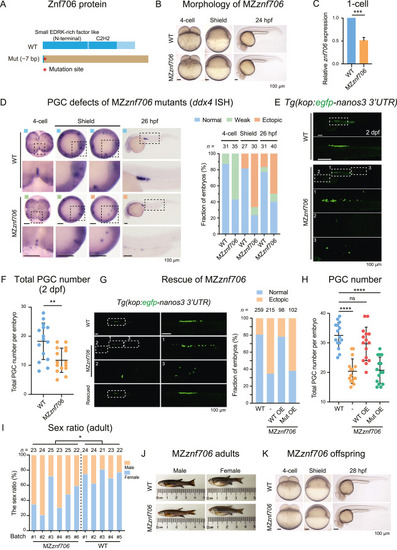
Defective PGC development in MZznf706 mutants by CRISPR/Cas9. A: Schematic diagram showing WT and predicted mutant Znf706 protein structures. Red asterisk, the mutated site; brown square, the mutated amino acid sequence. B: Morphology of MZznf706 mutants and WT embryos. C: Relative expression levels of znf706 in WT and MZznf706 embryos at 1-cell stage detected by qRT-PCR. D: Left, ISH of ddx4 showing germ plasm and PGCs in WT and MZznf706 embryos at 4-cell, shield, and 26 hpf stages. The dashed boxed areas were enlarged for better viewing. Blue square represented embryos with normal PGC number and proper location; green square represented embryos with reduced ddx4 signal; orange square represented embryos with ectopically located PGCs (>1). Right, histogram showing the proportion of embryos as exemplified in ddx4 ISH (left). E: Representative images of PGCs in WT and MZznf706 embryos, labeled by GFP in the Tg(kop:egfp-CAAX-nanos3 3′UTR) transgenic background. The dashed boxed areas were enlarged for better viewing. F: Scatter plots illustrating the discrepancy in PGC counts (E). Fifteen larvae were observed for each group. G: Fluorescence images (left) showing PGCs in WT embryos, MZznf706 embryos (-), and MZznf706 embryos injected with WT znf706 mRNA (Rescued). Bar plot (right) showing the ratio of embryos with ectopic PGCs (ectopic, orange) or without ectopic PGCs (normal, blue). WT OE, overexpression of WT znf706 mRNA; Mut OE, overexpression of mutant form znf706 mRNA. H: Scatter plots illustrating the PGC number per embryo (G). Fifteen larvae were observed for each group. I: Bar plot showing the sex ratio of MZznf706 and WT adults. n, number of fish per batch. J: Morphology of MZznf706 and WT adults. K: Morphology of WT embryos and offspring derived from MZznf706 incrossing. Scale bar, 100 μm (B, D, E, G, K). n, number of embryos (D and G). ns, not significant; ∗∗∗∗, P < 0.0001; ∗∗∗, P < 0.001; ∗∗, P < 0.01; ∗, P < 0.05. PGC, primordial germ cell; WT, wild-type; Mut, mutant; MZ, maternal-zygotic; ISH, in situ hybridization; hpf, hours post fertilization; OE, overexpression; dpf, days post fertilization. |
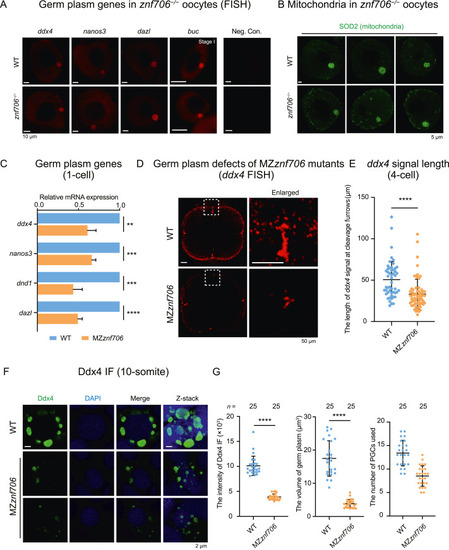
Znf706 is required for normal germ plasm assembly in PGCs. A: FISH of germ plasm genes (ddx4, nanos3, dazl, and buc) in WT and znf706−/− oocytes at stage I. B: Immunostaining of SOD2 showing the assembly of mitochondria in WT and znf706−/− stage I oocytes. C: Bar plot showing relative expression levels of germ plasm genes (ddx4, nanos3, dnd1, and dazl) in WT and MZznf706 embryos at 1-cell stage. D: FISH of ddx4 showing germ plasm at the cleavage furrows of WT and MZznf706 embryos at 4-cell stage. The dashed boxed areas were enlarged for better viewing. E: Scatter plot showing the length of ddx4 signals (indicating germ plasm) at cleavage furrows (D). Each dot in the scatter plot indicated ddx4 signal in one cleavage furrow in WT and MZznf706 embryos. The total numbers of dots are 51 in WT and 65 in MZznf706, respectively. F: Immunostaining of Ddx4 showing the distribution of germ plasm in WT and MZznf706 PGCs at 10-somite stage. G: Scatter plots showing the intensity (left), the volume of germ plasm granule (middle) of Ddx4 signals in PGCs, and the number of PGCs used for calculation (right) in WT and MZznf706 embryos at 10-somite stage (F). Twenty-five embryos in each group were analyzed. Scales bars, 10 μm (A); 5 μm (B); 50 μm (D); 2 μm (F). ∗∗∗∗, P < 0.0001; ∗∗∗, P < 0.001; ∗∗, P < 0.01. FISH, fluorescence in situ hybridization; MZ, maternal-zygotic; WT, wild-type; Neg. Con., negative control without probe. |
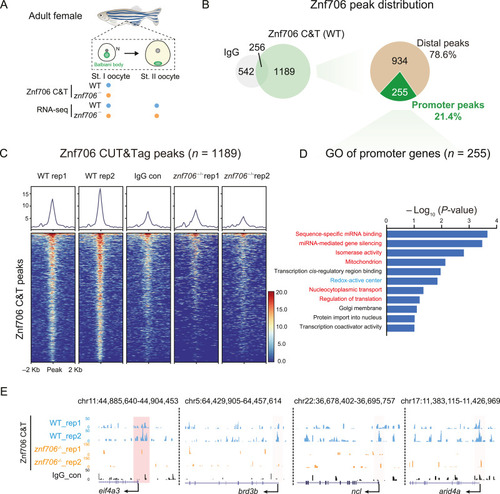
CUT&Tag of Znf706 in stage I oocytes. A: Schematic showing collection of stage I oocyte for CUT&Tag of Znf706 and stage I and II oocytes for RNA-seq. B: Venn diagrams illustrating the overlap between Znf706 and IgG CUT&Tag (left) and a pie chart showing the distribution of Znf706 peaks at promoter and distal regions (right). C: Heatmap showing the Znf706 in WT and znf706−/− oocytes and IgG in WT oocytes enrichment around peak center (peak center ± 2 kb). D: Bar plot showing GO analysis of 255 genes bound by Znf706 at the promoter regions. E: UCSC Genome Browser snapshots showing Znf706 and IgG peaks at promoter regions of eif4a3, brd3b, ncl, and arid4a. Pink shadows indicated promoter regions. WT, wild-type; st., stage; C&T, CUT&Tag. |
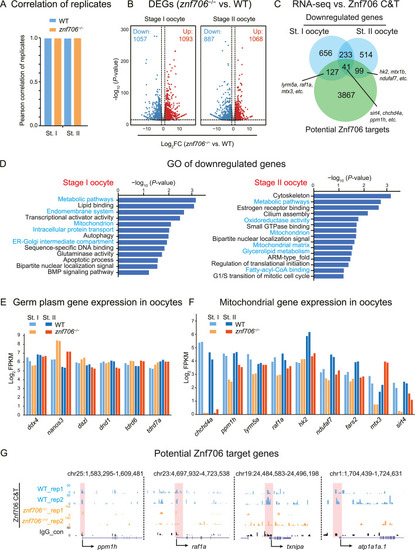
Transcriptome analysis of WT and znf706−/− oocytes. A: Bar graph showing the correlations between two biological replicates of WT and znf706−/− oocytes at stages I and II. B: Volcano plots illustrating gene expression changes between WT and znf706−/− oocytes at stages I and II. Red, upregulated genes; Blue, downregulated genes. C: Venn diagram illustrating the overlap between potential Znf706 target genes identified with either promoter (±2 kb of transcription start site) or distal peaks (around ±250 kb of distal peaks) by CUT&Tag and downregulated genes in znf706−/− oocytes by RNA-seq. D: Bar plots showing GO analysis of downregulated genes in znf706−/− oocytes at stages I (left) and II (right). E and F: Bar plots showing the expression levels of germ plasm genes (E) and mitochondrial genes (F) of WT (blue) and znf706−/− (orange) oocytes at stages I and II by RNA-seq. G: UCSC Genome Browser snapshots showing Znf706 and IgG peaks at promoter regions of ppm1h, raf1a, txnipa, and atp1a1a.1. Pink shadows indicated promoter regions. WT, wild-type; st., stage; C&T, CUT&Tag. |
Reprinted from Journal of genetics and genomics = Yi chuan xue bao, 52, Zhang, W., Li, Y., Li, H., Liu, X., Zheng, T., Li, G., Liu, B., Lv, T., Wei, Z., Xing, C., Jia, S., Meng, A., Wu, X., Znf706 regulates germ plasm assembly and primordial germ cell development in zebrafish, 666-679, Copyright (2024) with permission from Elsevier. Full text @ J. Genet. Genomics