
|
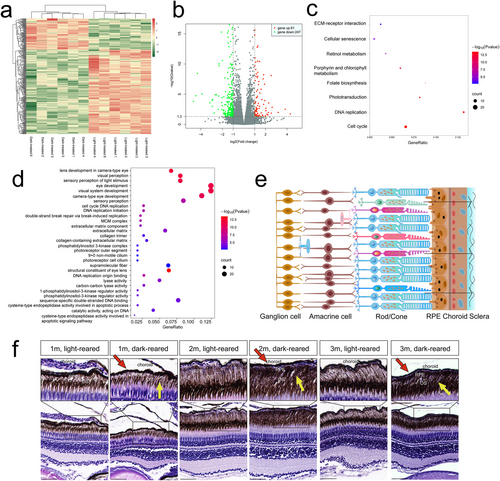
Fig. 2 Three-month-old zebrafish eyeball RNA sequencing and bioinformatic and histological analysis results (a, b) Heat map and volcano plot showing DEG in the eyes of light-reared versus dark-reared zebrafish. The red dots represent upregulated genes, and the green dots represent downregulated genes (|log2 (Fold Change)|> 1 and Q value < 0.05). (c, d) Bubble diagram of the KEGG and GO analyses. (e) Schematic diagram of the zebrafish retina structure. (f) Results of HE staining. Yellow arrows represent increased pigments in the photoreceptor outer segment. The red arrow indicates the thinning choroid. The scale bars refer to 50 μm. DEG, differentially expressed genes; GO, Gene Ontology; HE, hematoxylin–eosin; KEGG, Kyoto Encyclopedia of Genes and Genomes; m, month; OS, photoreceptor outer segment; RPE, retinal pigment epithelium.