
- Title
-
Rhodopsin Induces Myopia via Lipid Peroxidation in Zebrafish Reared in a Dark Environment
- Authors
- Liu, S., Fang, W., Pei, Y., Chen, T., Li, B., Liang, Y., Lu, X., Li, J.
- Source
- Full text @ FASEB J.
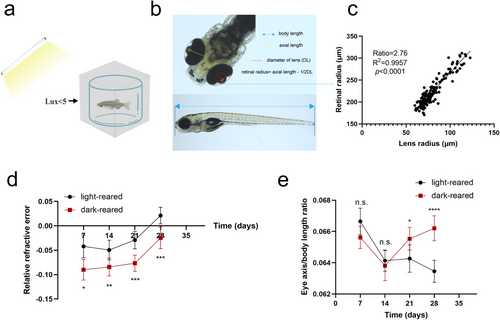
Ocular parameter changes in dark-reared zebrafish (a) Dark-reared fish are raised in an environment with low-light intensity (1–5 lx). (b) Definition of eye parameters. (c) The ratio coefficient used in this study was extrapolated using the best-fit line, in which the light-reared zebrafish retinal radius shows a good linear relationship with the lens radius. (d, e) Relative refractive error and eye axis/body length ratio measurements in light- and dark-reared zebrafish. For light-reared zebrafish, n = 40, 38, 30, and 44 eyes at 7, 14, 21, and 28 days post-fertilization, respectively. For dark-reared zebrafish, n = 50, 32, 30, and 54 eyes at 7, 14, 21, and 28 days post-fertilization, respectively. Statistical significance was analyzed using Student's t-test: N.s., no significance; *p < 0.05; **p < 0.01; ***p < 0.001; ****p < 0.0001. |
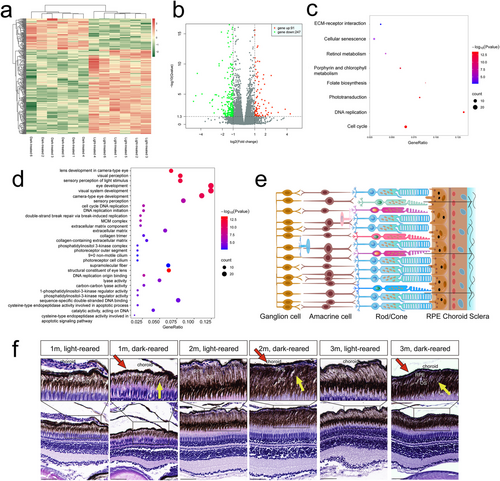
Three-month-old zebrafish eyeball RNA sequencing and bioinformatic and histological analysis results (a, b) Heat map and volcano plot showing DEG in the eyes of light-reared versus dark-reared zebrafish. The red dots represent upregulated genes, and the green dots represent downregulated genes (|log2 (Fold Change)|> 1 and Q value < 0.05). (c, d) Bubble diagram of the KEGG and GO analyses. (e) Schematic diagram of the zebrafish retina structure. (f) Results of HE staining. Yellow arrows represent increased pigments in the photoreceptor outer segment. The red arrow indicates the thinning choroid. The scale bars refer to 50 μm. DEG, differentially expressed genes; GO, Gene Ontology; HE, hematoxylin–eosin; KEGG, Kyoto Encyclopedia of Genes and Genomes; m, month; OS, photoreceptor outer segment; RPE, retinal pigment epithelium. |
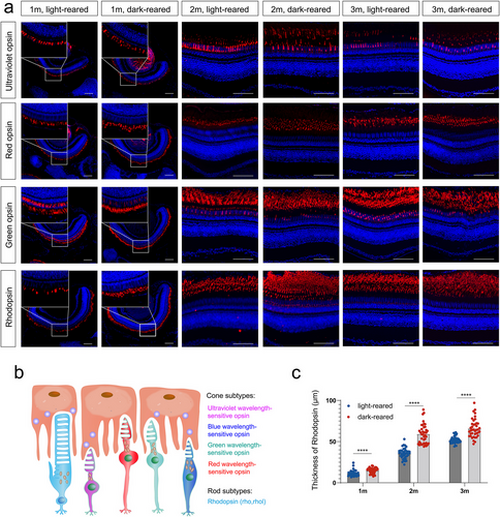
Expression of opsin in light- and dark-reared zebrafish retinas (a) Immunostaining of retinal paraffin sections, in which opsins are labeled in red and DAPI is marked in blue. The scale bars are 50 μm. (b) The pattern of zebrafish opsin isoforms, including four types of cone opsin and one type of rod opsin. (c) Quantitative measurement of rhodopsin thickness in zebrafish at 1, 2, and 3 months. n = 8 eyes per group at each time point. Statistical comparisons between individual groups were carried out using the Student's t-test. m, month; DAPI, 4′,6-diamidino-2-phenylindole. ****p < 0.0001 |
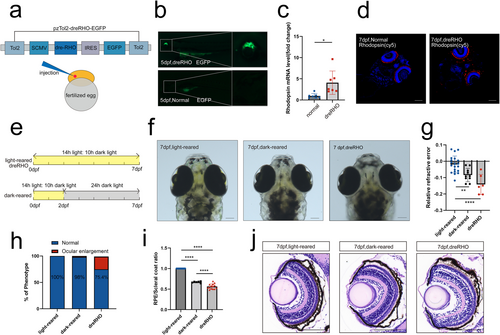
Rhodopsin overexpression led to RRE changes and scleral enlargement in zebrafish larvae. (a) dreRHO structure. Plasmids are introduced by microinjection into the yolk sacs of fertilized eggs. (b) EGFP expression is observed in zebrafish at 5 dpf. (c) Rhodopsin mRNA levels of zebrafish at 7 dpf. n = 7 eyes per group. (d) Rhodopsin immunofluorescence staining (4D2). (e) Light cycles in three groups of zebrafish. (f) Zebrafish photographed under a microscope at 7 dpf. (g) Relative refractive error at 7 dpf; n = 20, 10, and 10 eyes for light-reared, dark-reared, and dreRHO group, respectively. (h) Proportion of ocular enlargement phenotypes. n = 600, 600, and 200 eyes for light-reared, dark-reared, and dreRHO group, respectively. (i) Ratio of RPE diameter to scleral diameter; n = 20, 6, and 14 eyes for light-reared, dark-reared, and dreRHO group, respectively. (j) Results of HE staining on the eyeballs at 7 dpf. Statistical significance was determined using the Student's t-test and the one-way ANOVA with Bonferroni correction (more than two groups). The scale bars are 100 μm. ANOVA, analysis of variance; dreRHO, rhodopsin expression plasmid; EGFP, enhanced green fluorescent protein; HE, hematoxylin–eosin; mRNA, messenger ribonucleic acid; RPE, retinal pigment epithelial. *p < 0.05, **p < 0.01, ****p < 0.0001. |
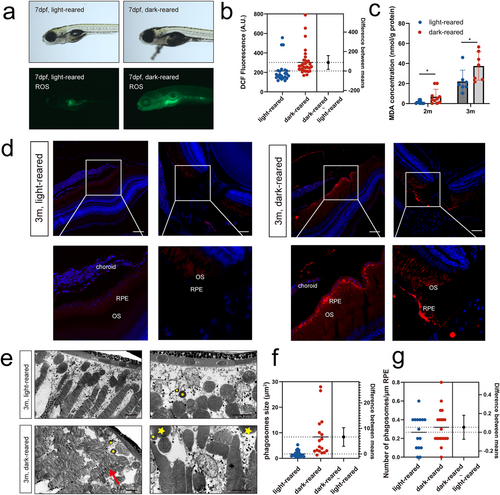
Lipid peroxidation in the retinas of zebrafish reared under a dark environment (a) Representative images of bright fields and fluorescence for ROS detection by DCFH-DA incubation. (b) Statistical analysis of DCF fluorescence by estimation plot; n = 23 for the light-reared and n = 33 for the dark-reared group. (c) MDA concentrations in zebrafish eyeballs in the two groups. n = 11 for the light-reared and n = 10 for the dark-reared group at 2 months; n = 7 for the light-reared and n = 7 for the dark-reared group at 3 months. (d) 4-HNE immunofluorescence of the retina and optic nerve. (e) Transmission electron microscopy of the outer segment of rod cells of 3-month-old adult fish. Yellow stars represent phagosomes, while red arrows refer to the discoid structure of the outer segment of the rod cells. (f, g) Estimation plot showing the number and size of phagosomes, respectively. Statistical significance was determined using the Student's t-test. The scale bars are 50 μm. 4-HNE, 4-hydroxynonenal; DCF, dichlorofluorescein; DCFH-DA, 2′,7′-dichlorodihydroxyoxalol diacetate; MDA, malondialdehyde. *p < 0.05. |
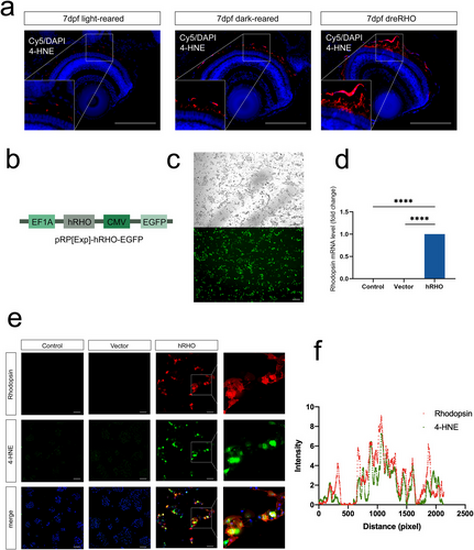
Rhodopsin induces accumulation of 4-HNE in the retinal pigment epithelium (a) Immunostaining of eye paraffin sections in which 4-HNE is labeled in red and DAPI is marked in blue. (b) Plasmid structure of rhodopsin. (c) Plasmid EGFP fluorescence and rhodopsin expression levels after transfection. (d) Rhodopsin mRNA levels detected using qRT-PCR. (e) Immunofluorescence. (f) Fluorescence colocalization analysis. Scale bars are 50 μm. 4-HNE, 4-hydroxynonenal; DAPI, 4′,6-diamidino-2-phenylindole; EGFP, enhanced green fluorescent protein; mRNA, messenger ribonucleic acid; qRT-PCR, quantitative reverse transcriptase polymerase chain reaction. ****p < 0.0001. |
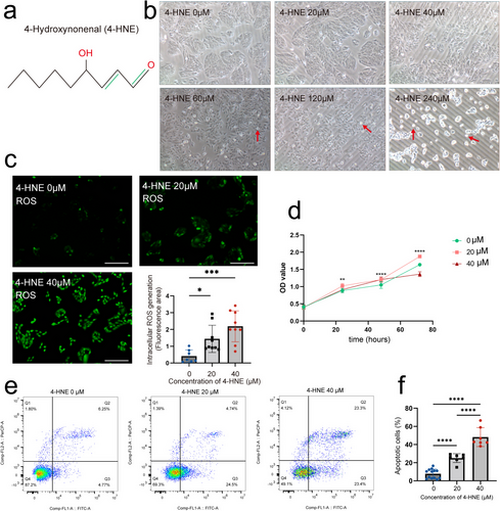
Effects of different concentrations of 4-HNE on ARPE-19 cells (a) Chemical structure of 4-HNE. (b) Cell morphology changes after 24 h of treatment with 4-HNE. The red arrows show shrunken and rounded cells. (c) Representative DCFH-DA images of ARPE-19 cells treated with 0, 20, and 40 μM 4-HNE for 24 h. Relative ROS levels were quantified using ImageJ software. n = 7, 9, and 9 for 0, 20, and 40 μM groups, respectively. (d) The proliferation of ARPE-19 cells treated with 4-HNE is observed using CCK-8 assay. (e, f) Flow cytometry analysis of apoptosis; n = 13, 7, and 7 for each group. Statistical significance was determined using the one-way ANOVA with Bonferroni correction. The scale bars refer to 100 μm. 4-HNE, 4-hydroxynonenal; ANOVA, analysis of variance; CCK-8, DCFH-DA: 2′,7′-dichlorodihydrofluorescein diacetate; ROS, reactive oxygen species. *p < 0.05, **p < 0.01, ***p < 0.001, ****p < 0.0001. |
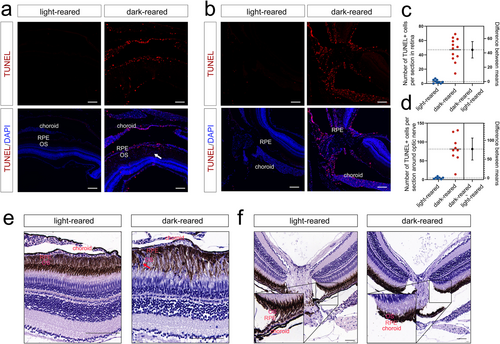
TUNEL and HE staining of 3-month-old zebrafish (a, b) TUNEL staining of the peripheral retina (n = 9 for the light-reared group and n = 12 for the dark-reared group) and optic nerve (n = 7 for the light-reared group and n = 9 for the dark-reared group). The white arrow indicates the migration of the RPE with blue fluorescence marked by DAPI. (c, d) Statistical results of TUNEL staining. (e, f) HE staining suggested thinning of the choroid and RPE migration (shown by the red arrow). The scale bars are 100 μm. DAPI, 4′,6-diamidino-2-phenylindole; HE, hematoxylin–eosin; RPE, retinal pigment epithelium; TUNEL, terminal deoxynucleotidyl transferase-mediated dutp nick-end labeling. |