
|
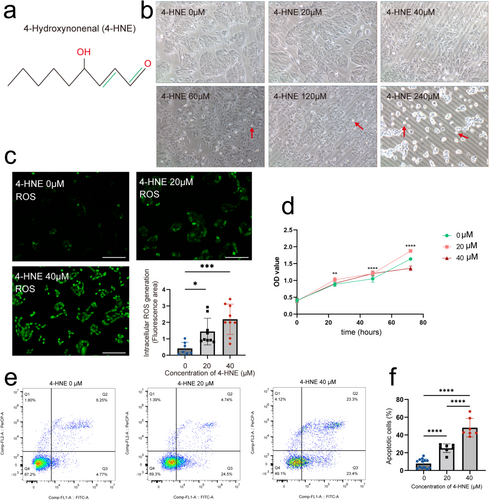
Fig. 7 Effects of different concentrations of 4-HNE on ARPE-19 cells (a) Chemical structure of 4-HNE. (b) Cell morphology changes after 24 h of treatment with 4-HNE. The red arrows show shrunken and rounded cells. (c) Representative DCFH-DA images of ARPE-19 cells treated with 0, 20, and 40 μM 4-HNE for 24 h. Relative ROS levels were quantified using ImageJ software. n = 7, 9, and 9 for 0, 20, and 40 μM groups, respectively. (d) The proliferation of ARPE-19 cells treated with 4-HNE is observed using CCK-8 assay. (e, f) Flow cytometry analysis of apoptosis; n = 13, 7, and 7 for each group. Statistical significance was determined using the one-way ANOVA with Bonferroni correction. The scale bars refer to 100 μm. 4-HNE, 4-hydroxynonenal; ANOVA, analysis of variance; CCK-8, DCFH-DA: 2′,7′-dichlorodihydrofluorescein diacetate; ROS, reactive oxygen species. *p < 0.05, **p < 0.01, ***p < 0.001, ****p < 0.0001.