
|
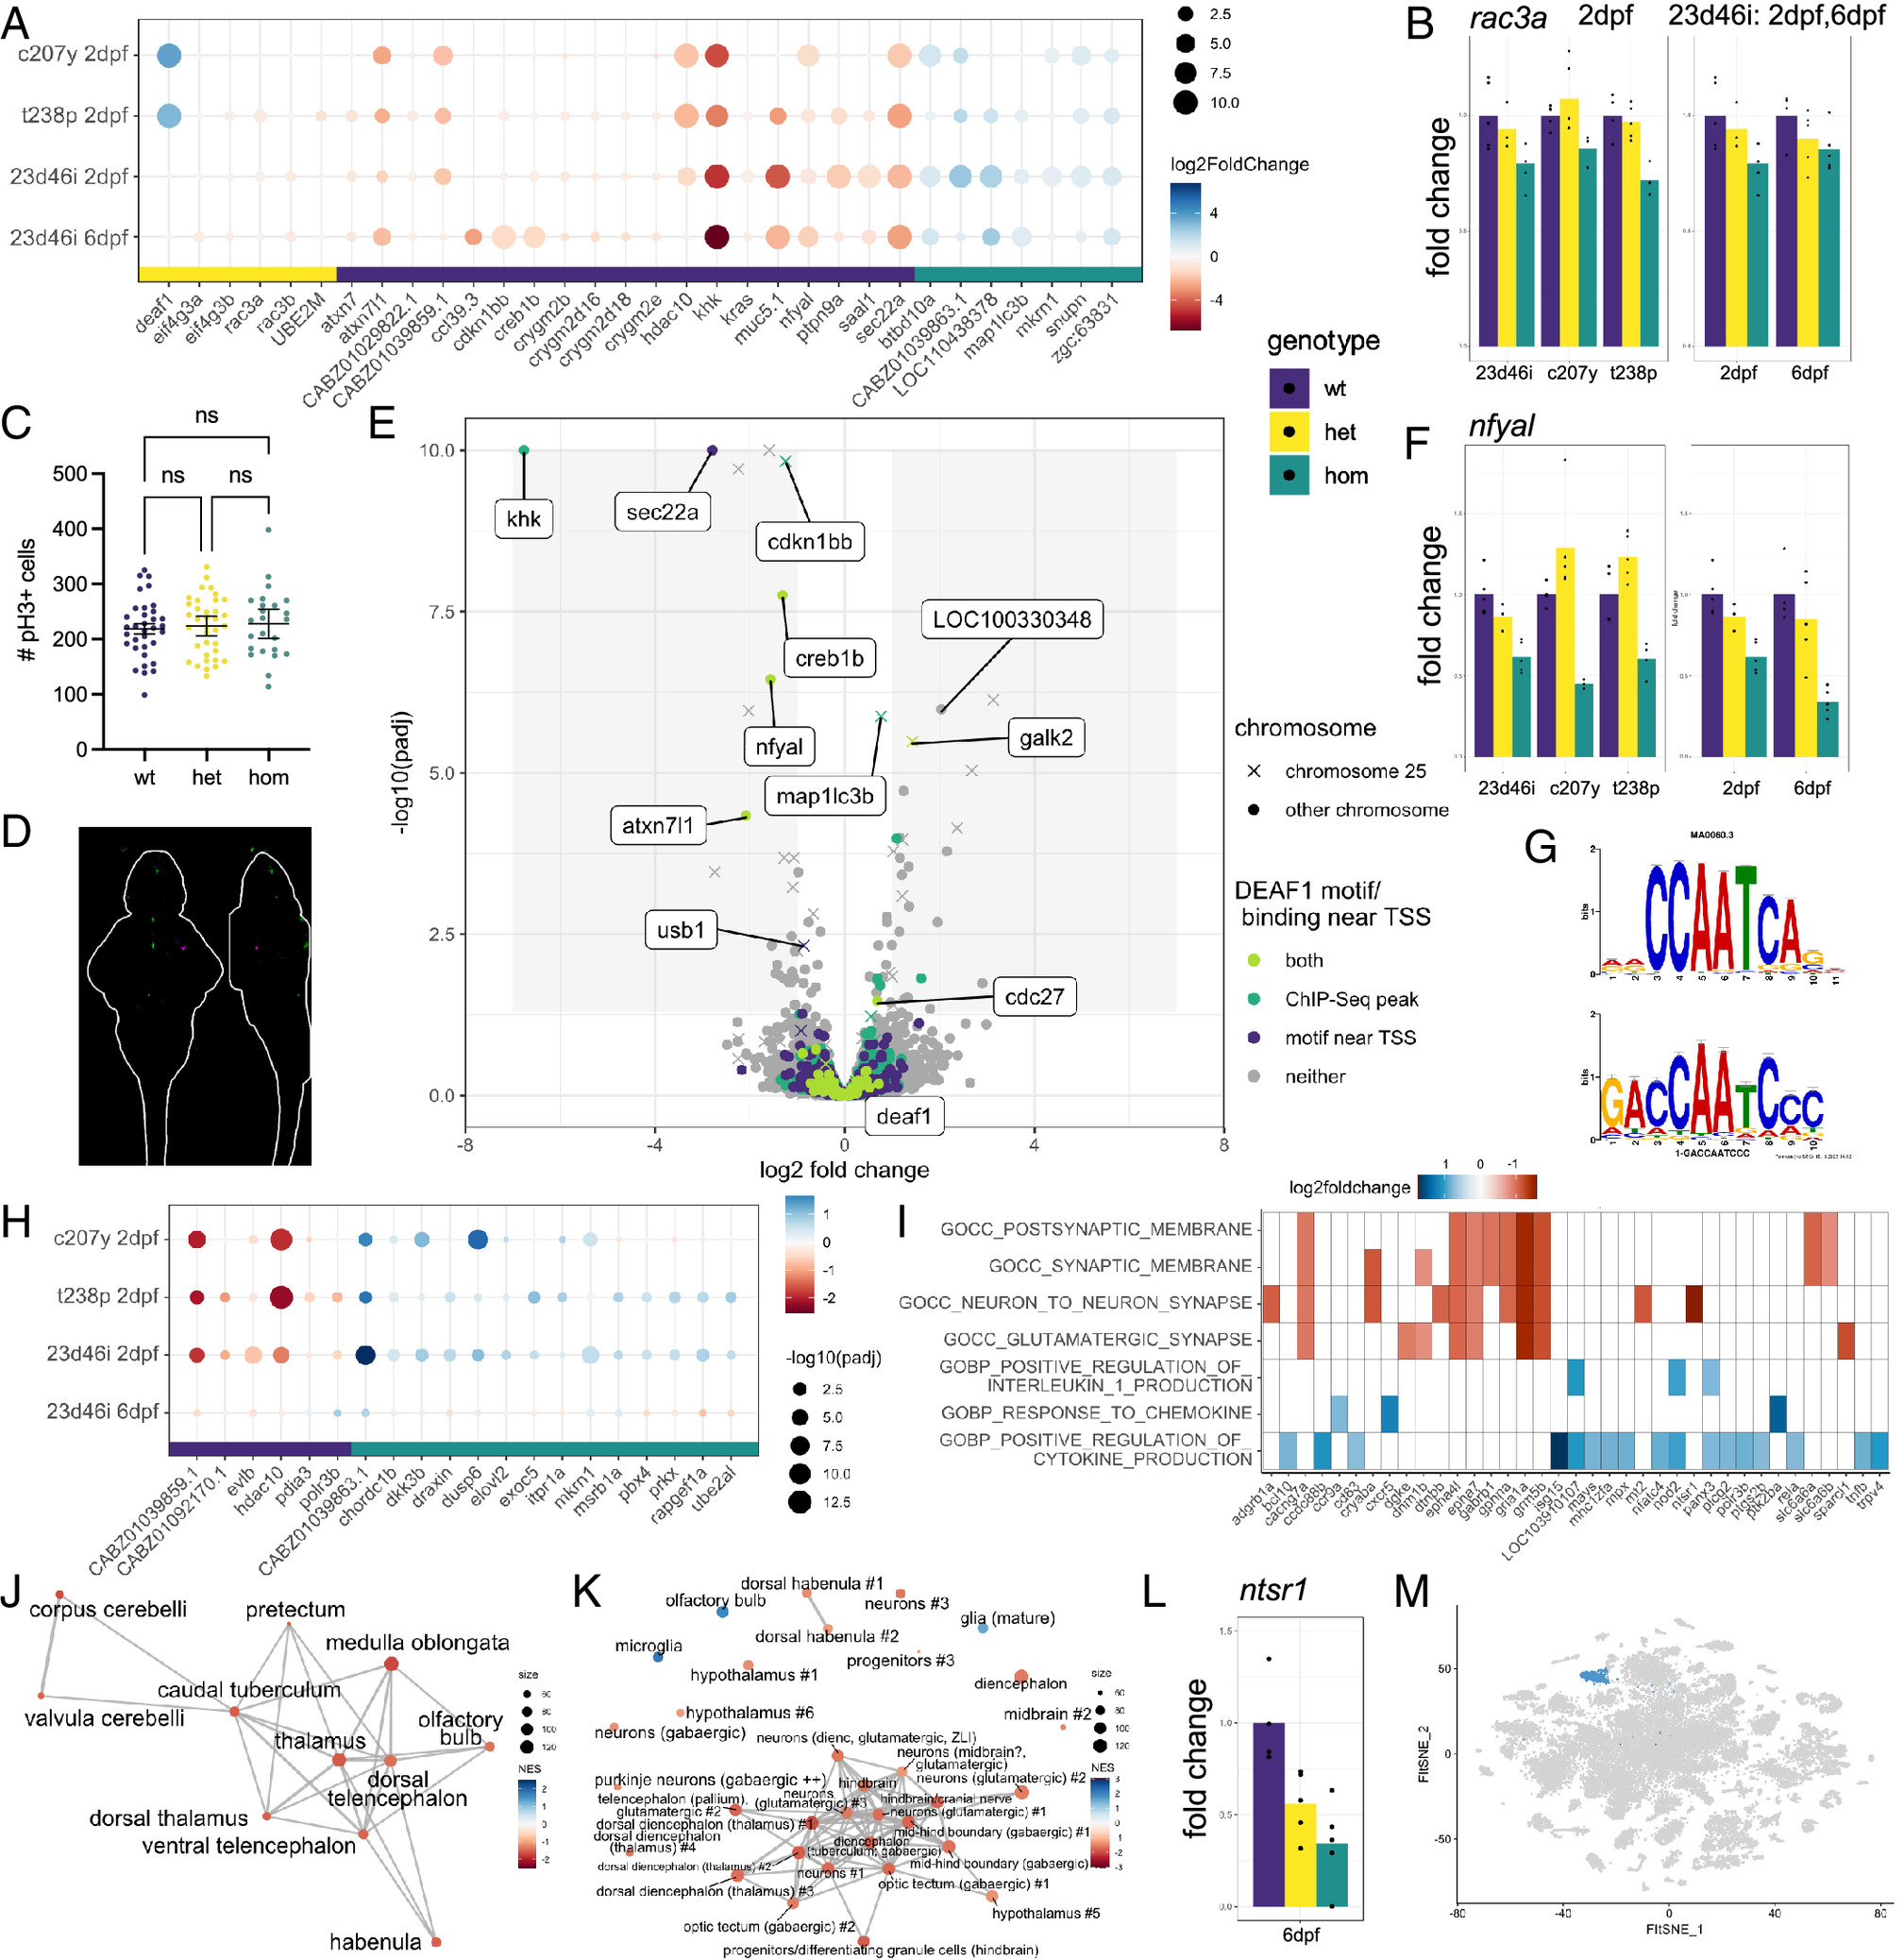
Fig. 4 Differential gene expression analysis of deaf1 mutant lines. (A) Genes shared across at least two of the four datasets. (B) Example expression of rac3a, one of the top downregulated genes the mouse hippocampus when Deaf1 is downregulated (47). The graph on the left compares the 23d46i, c207y, and t238p lines at 2 dpf, while the graph on the right compares the 23d46i line at 2 and 6 dpf. Homozygous vs. wild type (P value, Padj): 23d46i-2dpf (0.002, 0.18), c207y-2dpf (0.06, 0.99), t238p-2dpf (8E-05, 0.012), 23d46i-6dpf (0.11, 0.70). The P values for all plots of fold change are available in the tables on GitHub (https://github.com/thymelab/DataS1). (C) Number of pH3+ cells in the deaf1 23d46i 4 dpf mutant brains compared to siblings. Confocal stacks were registered, and the brain was segmented from the image using Z-Brain masks. No significance difference (Brown–Forsythe and Welch ANOVA) was found for the whole image, whole brain, or subregions. (D) PCNA staining intensity comparing 27 homozygous mutant larvae compared to 27 heterozygous siblings displayed as sum-of-slices projections (Z- and X-axes). Larvae were derived from a heterozygous female parent crossed with a homozygous male. Green indicates increased PCNA and magenta indicates decreased. (E) Volcano plot identifying putative direct targets of Deaf1 and other differentially expressed genes at 6 dpf in the 23d46i line. Genes located on the same chromosome as deaf1 (chr25) are annotated. (F) Reduced expression of nfyal in the 23d46i lines. Homozygous vs. wild type (P value, Padj): 23d46i-2dpf (7.67E-07, 0.0005), c207y-2dpf (4.34E-12, 7.55E-09), t238p-2dpf (2.44E-05, 0.0055), 23d46i-6dpf (1.20E-10, 3.55E-07). (G) NFYA1 motif result from Tomtom (Top) and query (Bottom) from STREME. (H) Genes that are most different between the 6 dpf sample and other three samples. (I) Selected GSEA C5 molecular signatures for the deaf1-23d46i 6 dpf data. (J) Network Enrichment Map of the ZFA enrichment results. Nodes represent enriched ZFA terms and edges join those terms with overlapping gene expression. (K) GSEA network plot with single-cell types from the same age. (L) Downregulation of ntsr1, marker of cluster 34 (“hypothalamus #1”), in the 6 dpf data. Homozygous vs. wild type P value, Padj = 0.0057, 0.28. (M) Cluster 34 in the published scRNA-seq data from 5 dpf heads (29).