
- Title
-
Disrupted diencephalon development and neuropeptidergic pathways in zebrafish with autism-risk mutations
- Authors
- Capps, M.E.S., Moyer, A.J., Conklin, C.L., Martina, V., Torija-Olson, E.G., Klein, M.C., Gannaway, W.C., Calhoun, C.C.S., Vivian, M.D., Thyme, S.B.
- Source
- Full text @ Proc. Natl. Acad. Sci. USA
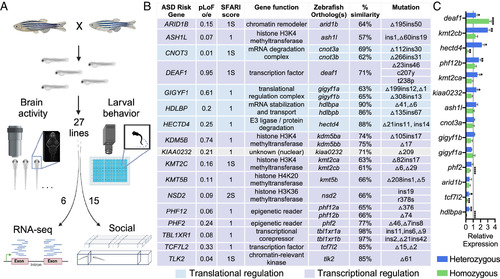
Generation and analysis of mutants for genes that increase risk for ASD. (A) Pipeline of the screen. Mutant lines generated with CRISPR/Cas9 were crossed together, and sibling larvae were assessed for changes to brain morphology, brain activity, and behavioral profiling in 96-well plates. Subsets of lines were further characterized with bulk mRNA-sequencing of dissected heads or social behavior. Created with BioRender.com. (B) Selected genes that increase risk for ASD and corresponding zebrafish CRISPR/Cas9 alleles. The pLoF observed/expected (o/e) score for loss-of-function mutations is from gnomAD database, and a low value indicates the gene is resistant to mutation in humans. A Simons Foundation Autism Research Initiative (SFARI) score of 1 indicates that the genes are implicated in ASD with high confidence, and the syndromic (S) designation indicates genes associated with increased ASD risk and additional characteristics. (C) The relative change to mRNA levels using qPCR for selected zebrafish mutant lines. The heterozygous and homozygous samples are normalized relative to the wild-type level, indicated by the dashed line at 1. Statistical significance represents comparison to the wild-type level, using Brown–Forsythe and Welch ANOVA corrected for multiple comparisons. Data for the remaining mutants are available in SI Appendix, Fig. S3. |
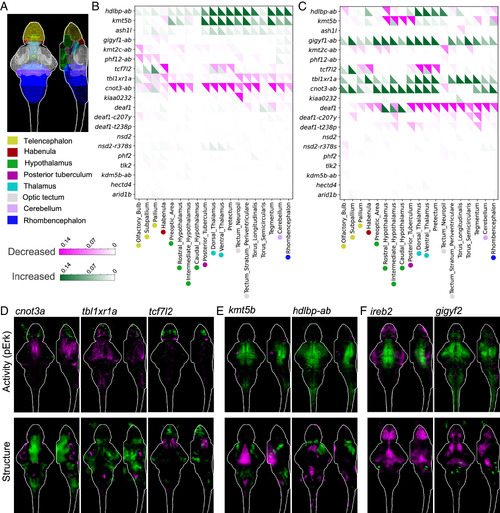
Whole-brain activity and morphology phenotypes in zebrafish mutants. (A) Location of selected major regions in the zebrafish brain (22). (B) Summary of pErk comparisons between groups, where magenta represents decreased activity and green represents increased. The signal in each region was summed and divided by the total size of that region. Displayed data are the following comparisons from the run1 set: homozygous −/− vs. wild type +/+ for single gene mutants and −/−;−/− vs. +/+;+/+ for all double mutants except cnot3-ab (−/−;+/− vs. +/+;+/+). Imaging is performed blinded to genotype. The N for all experiments is available in Dataset S1, and the average Ns are 19 (−/−, homozygous), 36 (+/−, heterozygous), and 22 (+/+, wild type). (C) Summary of structure comparisons between groups, where magenta represents decreased size and green represents increased. The structural measure was calculated using deformation-based morphometry, as previously described (17). (D) Examples of activity and structural differences in mutants displayed as sum-of-slices projections (Z- and X-axes). Brain images represent the significant differences in signal between two groups. (E) Examples of activity and structural differences in mutants displayed as sum-of-slices projections (Z- and X-axes). Brain images represent the significant differences in signal between two groups. (F) Brain activity and structural maps from data in our previous screen of 132 schizophrenia-associated genes (17). |
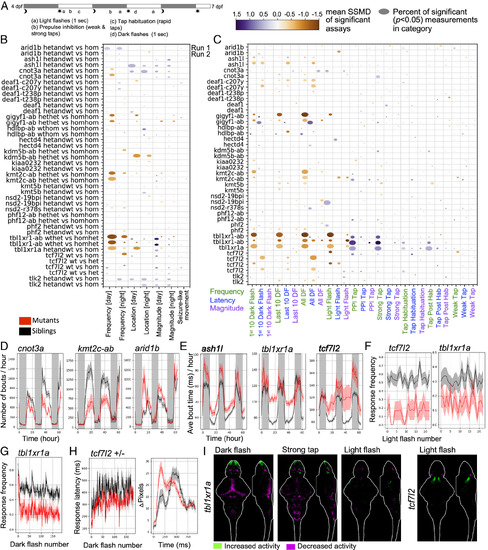
Behavioral phenotypes in zebrafish mutants. (A) Behavioral assay protocol. (B) Visualization of baseline behavioral phenotypes. Frequency of movement (e.g., number of bouts/h), magnitude of movement (e.g., bout distance traveled), and location (e.g., fraction of bout in center of well) preferences were calculated for the baseline data. The size of the bubble represents the percent of significant measurements in the summarized category, and the color represents the mean of the strictly standardized mean difference (SSMD) of the significant assays in that category. Two biological replicates from independent embryo batches are shown. Behavioral phenotyping is performed blinded to genotype. The N for all experiments is available in Dataset S1, and the average Ns are 17 (−/−, homozygous), 33 (+/−, heterozygous), and 19 (+/+, wild type). The comparisons of genotype separately are available in SI Appendix, Figs. S8 and S9. (C) Visualization of stimulus-driven behavioral phenotypes. Stimulus responses were quantified from high-speed (285 frames-per-second) 1-s-long movies. The bubble size and color are calculated the same as in panel B. The comparisons of genotype separately are available in SI Appendix, Figs. S12 and S13. (D) Examples of altered frequency of movement for the duration of the experiment. (E) Examples of increased movement magnitude (bout time) for the duration of the experiment. (F) Example of a reduced response frequency to 1 s light flashes (6 dpf evening light flashes). P values: 0.002 (tbl1xr1a) and <0.0001 (tcf7l2). (G) Reduced response frequency to 1 s dark flashes (all dark flash blocks, 6 dpf). P value < 0.0001. (H) Decreased response latency (Left) for the tcf7l2 heterozygous larvae compared to wild-type siblings. P value = 0.0009. The response graph (Right) is an average of larvae in the mutant and control groups for events where a response was observed. Plots of the mutant compared to control groups in panels D–H represent mean ± SEM. P values are Kruskal–Wallis ANOVA. (I) Activity differences in homozygous mutants compared to wild type siblings exposed to stimuli and displayed as sum-of-slices projections (Z- and X-axes). Additional experiments, genotype comparisons, and N are available in SI Appendix, Fig. S16. |
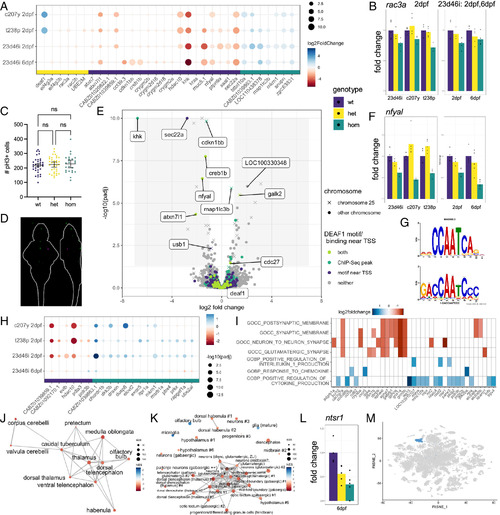
Differential gene expression analysis of deaf1 mutant lines. (A) Genes shared across at least two of the four datasets. (B) Example expression of rac3a, one of the top downregulated genes the mouse hippocampus when Deaf1 is downregulated (47). The graph on the left compares the 23d46i, c207y, and t238p lines at 2 dpf, while the graph on the right compares the 23d46i line at 2 and 6 dpf. Homozygous vs. wild type (P value, Padj): 23d46i-2dpf (0.002, 0.18), c207y-2dpf (0.06, 0.99), t238p-2dpf (8E-05, 0.012), 23d46i-6dpf (0.11, 0.70). The P values for all plots of fold change are available in the tables on GitHub (https://github.com/thymelab/DataS1). (C) Number of pH3+ cells in the deaf1 23d46i 4 dpf mutant brains compared to siblings. Confocal stacks were registered, and the brain was segmented from the image using Z-Brain masks. No significance difference (Brown–Forsythe and Welch ANOVA) was found for the whole image, whole brain, or subregions. (D) PCNA staining intensity comparing 27 homozygous mutant larvae compared to 27 heterozygous siblings displayed as sum-of-slices projections (Z- and X-axes). Larvae were derived from a heterozygous female parent crossed with a homozygous male. Green indicates increased PCNA and magenta indicates decreased. (E) Volcano plot identifying putative direct targets of Deaf1 and other differentially expressed genes at 6 dpf in the 23d46i line. Genes located on the same chromosome as deaf1 (chr25) are annotated. (F) Reduced expression of nfyal in the 23d46i lines. Homozygous vs. wild type (P value, Padj): 23d46i-2dpf (7.67E-07, 0.0005), c207y-2dpf (4.34E-12, 7.55E-09), t238p-2dpf (2.44E-05, 0.0055), 23d46i-6dpf (1.20E-10, 3.55E-07). (G) NFYA1 motif result from Tomtom (Top) and query (Bottom) from STREME. (H) Genes that are most different between the 6 dpf sample and other three samples. (I) Selected GSEA C5 molecular signatures for the deaf1-23d46i 6 dpf data. (J) Network Enrichment Map of the ZFA enrichment results. Nodes represent enriched ZFA terms and edges join those terms with overlapping gene expression. (K) GSEA network plot with single-cell types from the same age. (L) Downregulation of ntsr1, marker of cluster 34 (“hypothalamus #1”), in the 6 dpf data. Homozygous vs. wild type P value, Padj = 0.0057, 0.28. (M) Cluster 34 in the published scRNA-seq data from 5 dpf heads (29). |
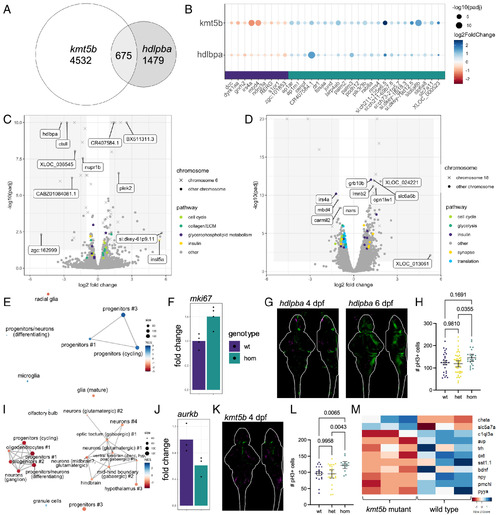
Differential gene expression analysis of kmt5b and hdlbpa mutant lines. (A) Euler diagram of the intersection of kmt5b and hdlbpa differentially expressed genes (P value < 0.05). (B) Differentially expressed genes shared between kmt5b and hdlbpa. (C) Volcano plot of the hdlbpa RNA sequencing data with genes in selected pathways highlighted. Genes located on the same chromosome as hdlbpa (chr6) are annotated. (D) Volcano plot of the kmt5b RNA sequencing data with genes in selected pathways highlighted. Genes located on the same chromosome as kmt5b (chr18) are annotated. (E) GSEA network plot with single-cell types from the same age for hdlbpa. (F) Upregulation of mki67, a marker of proliferation, in hdlbpa mutants. Homozygous vs. wild type P value, Padj = 7.21E-05, 0.019. (G) PCNA staining intensity comparing 13 homozygous mutant larvae to 32 wild type and heterozygous siblings at 4 dpf and 10 homozygous to 33 siblings at 4 dpf. Stacks are displayed as sum-of-slices projections (Z- and X-axes). Green indicates increased PCNA, and magenta indicates decreased. (H) Number of pH3+ cells in the mesencephalon and rhombencephalon regions of the hdlbpa 4 dpf mutant brains compared to siblings. Confocal stacks were registered, and the brain was segmented from the image using Z-Brain masks. Experiments were conducted at 4 dpf, as there is significantly more proliferation than at 6 dpf. Significance was determined with Brown–Forsythe and Welch ANOVA corrected for multiple comparisons. A two-tailed Mann–Whitney P value for homozygous mutants vs. the combined heterozygous and wild-type samples = 0.0197. (I) GSEA network plot with single-cell types from the same age for kmt5b. (J) Downregulation of aurkb, a marker of proliferation, in kmt5b mutants. Homozygous vs. wild type P value, Padj = 0.013, 0.13. (K) PCNA staining intensity comparing 8 homozygous mutant larvae to 29 wild type and heterozygous siblings at 4 dpf. (L) Number of pH3+ cells in the diencephalon and mesencephalon regions of the kmt5b 4 dpf mutant brains compared to siblings. (M) Genes that are dysregulated in kmt5b homozygous mutants compared to wild type siblings. |
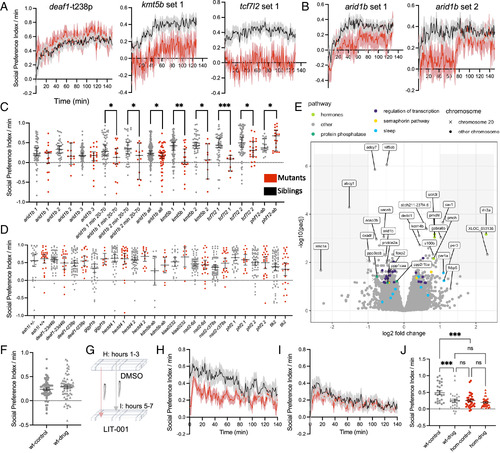
Juvenile social behavioral and transcriptomic differences. (A) Social Preference Index over the duration of the experiment, following removal of a white comb that blocks the view of the stimulus fish. The Social Preference Index per minute is defined as the number of frames in the zone near the stimulus fish (25% of the arena) minus the frames near the empty control well (25%) per minute. Plots of the mutant compared to control groups represent mean ± SEM. The N for all social behavior experiments is in Dataset S1. (B) Social Preference Index for two arid1b datasets that show differences in interaction level over the duration of the experiment. Plots of the mutant compared to control groups represent mean ± SEM. (C) Lines with social interaction phenotypes. The Social Preference Index per minute was averaged for each fish across the entire experiment (every point represents one animal). Significance was determined with the two-tailed Mann–Whitney test (arid1b 1 min 20 to 70: 0.0387, arid1b 2 min 20 to 70: 0.0407, arid1b all: 0.0228, kmt5b 1: 0.001, kmt5b 2: 0.0117, tcf7l2 1: 0.0001, tcf7l2 2: 0.0147, phf12-ab: 0.0286). Error bars represent the mean and 95% CI. (D) Lines without social interaction phenotypes. (E) Volcano plot of differentially expressed genes in arid1b adult brain samples. N = 7 homozygous mutants, 8 heterozygous. (F) Average of the Social Preference Index per fish for minutes 20 to 70 for an experiment where wild-type juveniles were simultaneously exposed to DMSO and LIT-001 rather than sequentially. Fish were exposed using a procedure in which alternating lanes were DMSO and LIT-001 to limit experimental noise, as animals in both conditions were assessed together in the same behavioral apparatus. Data from two biological replicates were combined for N = 61 DMSO, 58 LIT-001. No significant difference was detected. (G) Schematic of the social interaction test with drug exposure for kmt5b mutants. The same juveniles were first assessed in DMSO and then transferred to the corresponding well in a new plate with LIT-001, along with the same stimulus fish, to limit experimental noise from mutant genetic diversity, stimulus fish, and behavioral apparatus. (H) Social Preference Index over the duration of the DMSO experiment for kmt5b homozygous mutants compared to wild type siblings, following removal of the white comb. (I) Social Preference Index over the duration of the LIT-001 experiment for kmt5b homozygous mutants compared to wild-type siblings, following removal of the white comb. (J) Average of the Social Preference Index per fish for minutes 20 to 70. ***<0.001, ****<0.0001 with Brown–Forsythe and Welch ANOVA corrected for multiple comparisons. N = 27 wild types, 33 mutants. |