
|
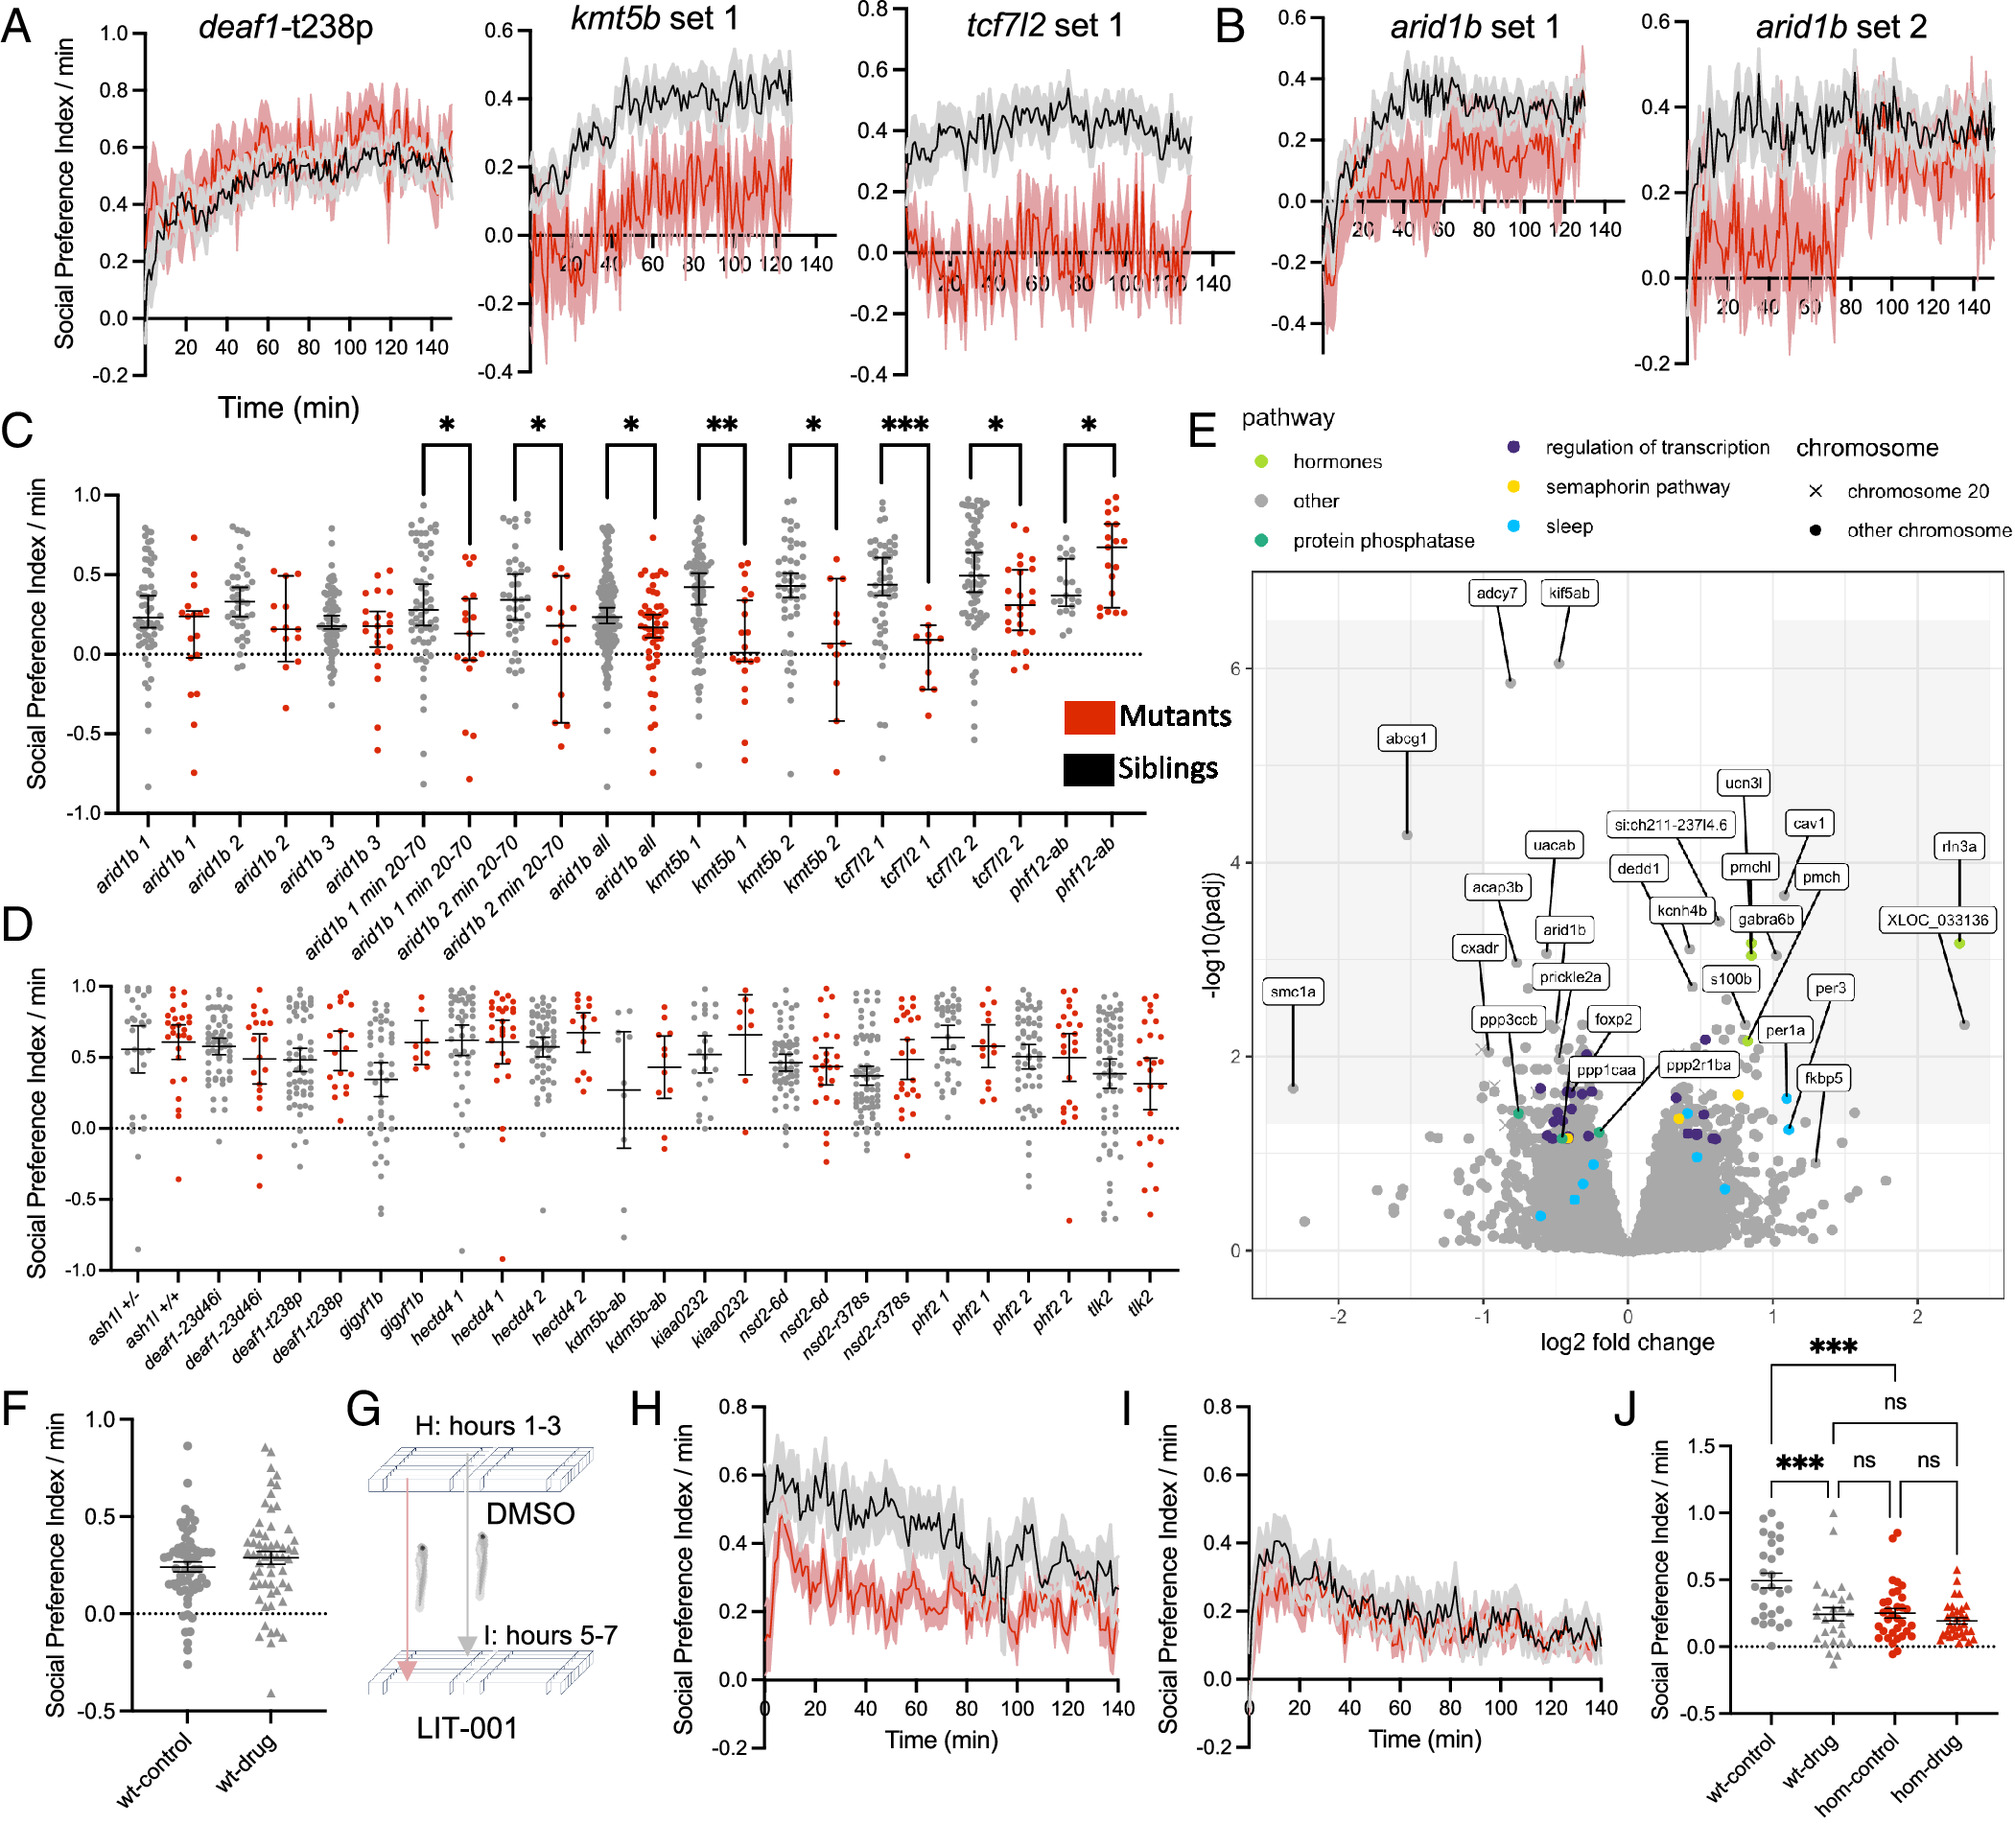
Fig. 6 Juvenile social behavioral and transcriptomic differences. (A) Social Preference Index over the duration of the experiment, following removal of a white comb that blocks the view of the stimulus fish. The Social Preference Index per minute is defined as the number of frames in the zone near the stimulus fish (25% of the arena) minus the frames near the empty control well (25%) per minute. Plots of the mutant compared to control groups represent mean ± SEM. The N for all social behavior experiments is in Dataset S1. (B) Social Preference Index for two arid1b datasets that show differences in interaction level over the duration of the experiment. Plots of the mutant compared to control groups represent mean ± SEM. (C) Lines with social interaction phenotypes. The Social Preference Index per minute was averaged for each fish across the entire experiment (every point represents one animal). Significance was determined with the two-tailed Mann–Whitney test (arid1b 1 min 20 to 70: 0.0387, arid1b 2 min 20 to 70: 0.0407, arid1b all: 0.0228, kmt5b 1: 0.001, kmt5b 2: 0.0117, tcf7l2 1: 0.0001, tcf7l2 2: 0.0147, phf12-ab: 0.0286). Error bars represent the mean and 95% CI. (D) Lines without social interaction phenotypes. (E) Volcano plot of differentially expressed genes in arid1b adult brain samples. N = 7 homozygous mutants, 8 heterozygous. (F) Average of the Social Preference Index per fish for minutes 20 to 70 for an experiment where wild-type juveniles were simultaneously exposed to DMSO and LIT-001 rather than sequentially. Fish were exposed using a procedure in which alternating lanes were DMSO and LIT-001 to limit experimental noise, as animals in both conditions were assessed together in the same behavioral apparatus. Data from two biological replicates were combined for N = 61 DMSO, 58 LIT-001. No significant difference was detected. (G) Schematic of the social interaction test with drug exposure for kmt5b mutants. The same juveniles were first assessed in DMSO and then transferred to the corresponding well in a new plate with LIT-001, along with the same stimulus fish, to limit experimental noise from mutant genetic diversity, stimulus fish, and behavioral apparatus. (H) Social Preference Index over the duration of the DMSO experiment for kmt5b homozygous mutants compared to wild type siblings, following removal of the white comb. (I) Social Preference Index over the duration of the LIT-001 experiment for kmt5b homozygous mutants compared to wild-type siblings, following removal of the white comb. (J) Average of the Social Preference Index per fish for minutes 20 to 70. ***<0.001, ****<0.0001 with Brown–Forsythe and Welch ANOVA corrected for multiple comparisons. N = 27 wild types, 33 mutants.