
Fig. 5
- ID
- ZDB-FIG-250626-30
- Publication
- Capps et al., 2025 - Disrupted diencephalon development and neuropeptidergic pathways in zebrafish with autism-risk mutations
- Other Figures
- All Figure Page
- Back to All Figure Page
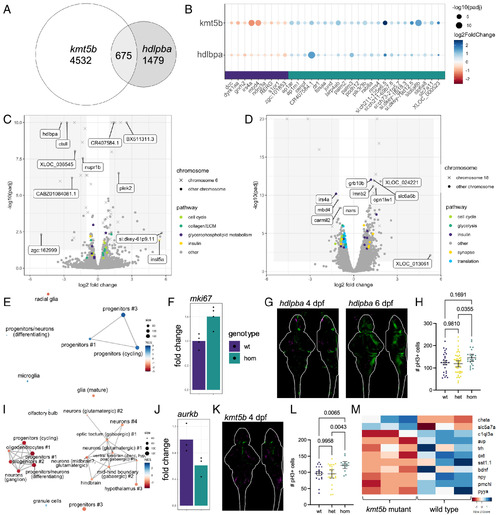
Differential gene expression analysis of kmt5b and hdlbpa mutant lines. (A) Euler diagram of the intersection of kmt5b and hdlbpa differentially expressed genes (P value < 0.05). (B) Differentially expressed genes shared between kmt5b and hdlbpa. (C) Volcano plot of the hdlbpa RNA sequencing data with genes in selected pathways highlighted. Genes located on the same chromosome as hdlbpa (chr6) are annotated. (D) Volcano plot of the kmt5b RNA sequencing data with genes in selected pathways highlighted. Genes located on the same chromosome as kmt5b (chr18) are annotated. (E) GSEA network plot with single-cell types from the same age for hdlbpa. (F) Upregulation of mki67, a marker of proliferation, in hdlbpa mutants. Homozygous vs. wild type P value, Padj = 7.21E-05, 0.019. (G) PCNA staining intensity comparing 13 homozygous mutant larvae to 32 wild type and heterozygous siblings at 4 dpf and 10 homozygous to 33 siblings at 4 dpf. Stacks are displayed as sum-of-slices projections (Z- and X-axes). Green indicates increased PCNA, and magenta indicates decreased. (H) Number of pH3+ cells in the mesencephalon and rhombencephalon regions of the hdlbpa 4 dpf mutant brains compared to siblings. Confocal stacks were registered, and the brain was segmented from the image using Z-Brain masks. Experiments were conducted at 4 dpf, as there is significantly more proliferation than at 6 dpf. Significance was determined with Brown–Forsythe and Welch ANOVA corrected for multiple comparisons. A two-tailed Mann–Whitney P value for homozygous mutants vs. the combined heterozygous and wild-type samples = 0.0197. (I) GSEA network plot with single-cell types from the same age for kmt5b. (J) Downregulation of aurkb, a marker of proliferation, in kmt5b mutants. Homozygous vs. wild type P value, Padj = 0.013, 0.13. (K) PCNA staining intensity comparing 8 homozygous mutant larvae to 29 wild type and heterozygous siblings at 4 dpf. (L) Number of pH3+ cells in the diencephalon and mesencephalon regions of the kmt5b 4 dpf mutant brains compared to siblings. (M) Genes that are dysregulated in kmt5b homozygous mutants compared to wild type siblings. |