
Fig. 3
- ID
- ZDB-FIG-250626-28
- Publication
- Capps et al., 2025 - Disrupted diencephalon development and neuropeptidergic pathways in zebrafish with autism-risk mutations
- Other Figures
- All Figure Page
- Back to All Figure Page
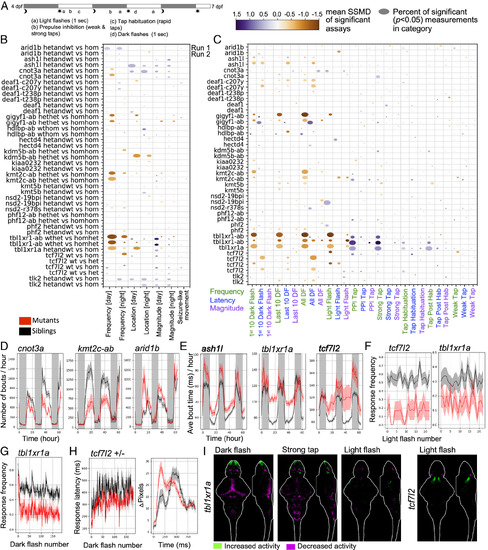
Behavioral phenotypes in zebrafish mutants. (A) Behavioral assay protocol. (B) Visualization of baseline behavioral phenotypes. Frequency of movement (e.g., number of bouts/h), magnitude of movement (e.g., bout distance traveled), and location (e.g., fraction of bout in center of well) preferences were calculated for the baseline data. The size of the bubble represents the percent of significant measurements in the summarized category, and the color represents the mean of the strictly standardized mean difference (SSMD) of the significant assays in that category. Two biological replicates from independent embryo batches are shown. Behavioral phenotyping is performed blinded to genotype. The N for all experiments is available in Dataset S1, and the average Ns are 17 (−/−, homozygous), 33 (+/−, heterozygous), and 19 (+/+, wild type). The comparisons of genotype separately are available in SI Appendix, Figs. S8 and S9. (C) Visualization of stimulus-driven behavioral phenotypes. Stimulus responses were quantified from high-speed (285 frames-per-second) 1-s-long movies. The bubble size and color are calculated the same as in panel B. The comparisons of genotype separately are available in SI Appendix, Figs. S12 and S13. (D) Examples of altered frequency of movement for the duration of the experiment. (E) Examples of increased movement magnitude (bout time) for the duration of the experiment. (F) Example of a reduced response frequency to 1 s light flashes (6 dpf evening light flashes). P values: 0.002 (tbl1xr1a) and <0.0001 (tcf7l2). (G) Reduced response frequency to 1 s dark flashes (all dark flash blocks, 6 dpf). P value < 0.0001. (H) Decreased response latency (Left) for the tcf7l2 heterozygous larvae compared to wild-type siblings. P value = 0.0009. The response graph (Right) is an average of larvae in the mutant and control groups for events where a response was observed. Plots of the mutant compared to control groups in panels D–H represent mean ± SEM. P values are Kruskal–Wallis ANOVA. (I) Activity differences in homozygous mutants compared to wild type siblings exposed to stimuli and displayed as sum-of-slices projections (Z- and X-axes). Additional experiments, genotype comparisons, and N are available in SI Appendix, Fig. S16. |