
Fig. 2
- ID
- ZDB-FIG-250626-27
- Publication
- Capps et al., 2025 - Disrupted diencephalon development and neuropeptidergic pathways in zebrafish with autism-risk mutations
- Other Figures
- All Figure Page
- Back to All Figure Page
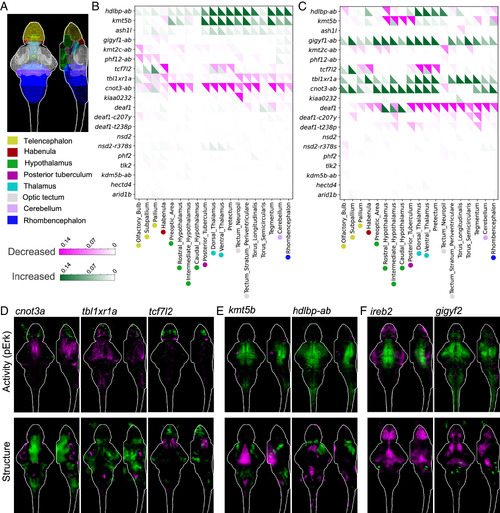
Whole-brain activity and morphology phenotypes in zebrafish mutants. (A) Location of selected major regions in the zebrafish brain (22). (B) Summary of pErk comparisons between groups, where magenta represents decreased activity and green represents increased. The signal in each region was summed and divided by the total size of that region. Displayed data are the following comparisons from the run1 set: homozygous −/− vs. wild type +/+ for single gene mutants and −/−;−/− vs. +/+;+/+ for all double mutants except cnot3-ab (−/−;+/− vs. +/+;+/+). Imaging is performed blinded to genotype. The N for all experiments is available in Dataset S1, and the average Ns are 19 (−/−, homozygous), 36 (+/−, heterozygous), and 22 (+/+, wild type). (C) Summary of structure comparisons between groups, where magenta represents decreased size and green represents increased. The structural measure was calculated using deformation-based morphometry, as previously described (17). (D) Examples of activity and structural differences in mutants displayed as sum-of-slices projections (Z- and X-axes). Brain images represent the significant differences in signal between two groups. (E) Examples of activity and structural differences in mutants displayed as sum-of-slices projections (Z- and X-axes). Brain images represent the significant differences in signal between two groups. (F) Brain activity and structural maps from data in our previous screen of 132 schizophrenia-associated genes (17). |