Figure Caption
Fig. 7.
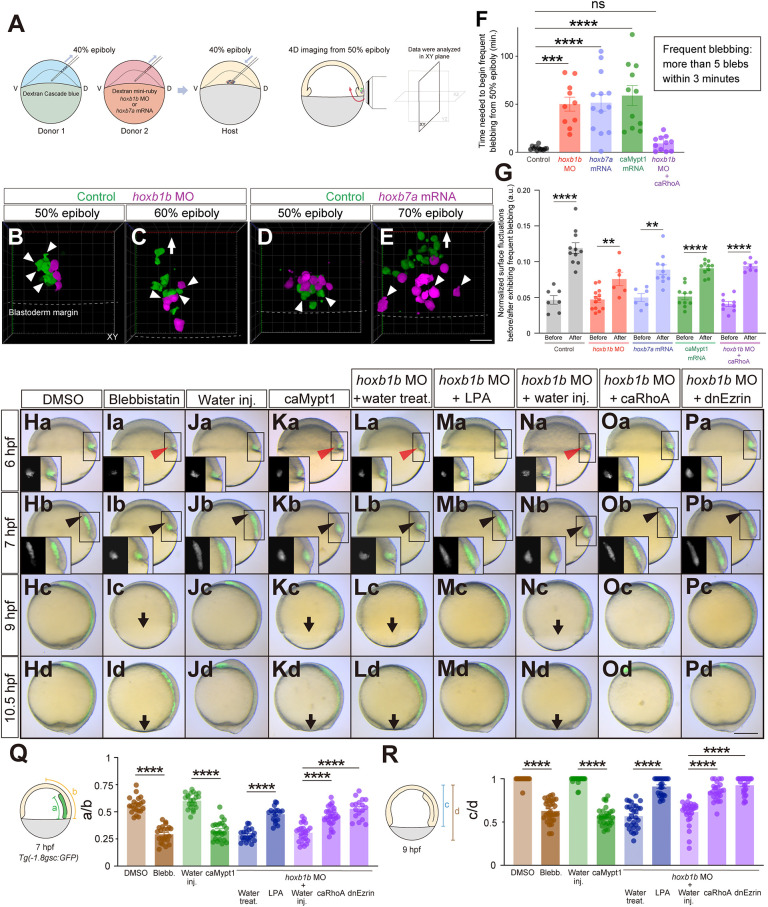
Hoxb expression affects mesendodermal cell blebbing and associated cell surface fluctuations. (A) Schematic of the cell transplantation assay and subsequent 4D imaging. D, dorsal; V, ventral. (B-E) Confocal fluorescence images (3D projection) of transplanted control (green) and hoxb1b MO (B,C) or hoxb7a mRNA (D,E) injected cells (magenta) at 50% epiboly (B,D) and 60% (C) or 70% (E) epiboly. Arrowheads point to cellular blebs. Arrow demarcates the migration direction of ingressed mesendodermal cells towards the animal pole. Dashed lines depict the borders between blastoderm margin and yolk. Scale bar: 60 µm. (F) Time needed for mesendodermal cells to begin frequent blebbing after the onset of imaging in control (n=12, N=4), hoxb1b MO (n=10, N=3), hoxb7a mRNA (n=13, N=4), caMypt1 mRNA (n=11, N=3) and hoxb1b MO plus caRhoA mRNA (n=11, N=4) injected cells. Frequent blebbing is defined as the state when a cell shows more than five blebs within 3 min. ***P<0.001, ****P<0.0001 (one-way ANOVA). (G) Normalized surface fluctuations of control (n=7, N=3 before; n=11, N=3 after), hoxb1b MO (n=13, N=3 before; n=6, N=3 after), hoxb7a mRNA (n=6, N=3 before; n=10, N=3 after), caMypt1 mRNA (n=10, N=3 before; n=10, N=3 after) and hoxb1b MO plus caRhoA mRNA (n=9, N=3 before; n=7, N=3 after) injected cells in the states before or after exhibiting frequent blebbing. **P<0.01; ****P<0.0001 (Mann–Whitney test). (Ha-Pd) Overlay of brightfield and fluorescence images of DMSO-treated (Ha-Hd), blebbistatin-treated (Ia-Id), water-injected (Ja-Jd), caMypt1 mRNA-injected (Ka-Kd) embryos, and water-treated (La-Ld), LPA-treated (Ma-Md), water-injected (Na-Nd) and caRhoA mRNA-injected (Oa-Od) and dnEzrin mRNA-injected (Pa-Pd) hoxb1b morphant embryos at 6 hfp, 7 hpf, 9 hpf and 10.5 hpf. Red arrowheads point to defective mesendodermal cell ingression at the dorsal blastoderm margin at 6 hpf. Black arrowheads point to the leading edge of mesendodermal cells migrating towards the animal pole. Arrows point to the blastoderm margin at 9 hpf. Dorsal side is to the right. Insets show separate brightfield and fluorescence images. Scale bar: 200 µm. (Q) Quantification of animal pole-oriented migration of mesendodermal cells [GFP-positive cells in Tg(-1.8gsc:GFP)] by the ratio of the length of the GFP-positive ingressed mesendoderm (a) to the distance from the blastoderm margin to the animal pole (b) in DMSO-treated (n=21, N=3), blebbistatin-treated (n=22, N=3), water-injected (n=22, N=3), caMypt1 mRNA-injected (n=23, N=3) embryos, and water-treated (n=20, N=3), LPA-treated (n=17, N=3), water-injected (n=24, N=3), caRhoA mRNA-injected (n=28, N=3) and dnEzrin mRNA-injected (n=17, N=3) hoxb1b morphant embryos at 7 hpf. ****P<0.0001 (one-way ANOVA). (R) Quantification of epiboly progression by the ratio of the blastoderm length (c) to the total embryo length from the animal pole to the vegetal pole (d) in DMSO-treated (n=17, N=3), blebbistatin-treated (n=30, N=3), water-injected (n=28, N=3), caMypt1 mRNA-injected (n=31, N=3) embryos, and water-treated (n=29, N=3), LPA-treated (n=24, N=3), water-injected (n=30, N=3), caRhoA mRNA-injected (n=25, N=3) and dnEzrin mRNA-injected (n=31, N=3) hoxb1b morphant embryos at 9 hpf. ****P<0.0001 (Kruskal–Wallis test). In F,G,Q,R, data are shown as mean±s.e.m. ns, not significant (P>0.05).
Acknowledgments
This image is the copyrighted work of the attributed author or publisher, and
ZFIN has permission only to display this image to its users.
Additional permissions should be obtained from the applicable author or publisher of the image.
Full text @ Development

