Hoxb gene expression at the blastoderm margin exhibits temporal collinearity during gastrulation. (Aa-Ef) Brightfield images (lateral views) of hoxb1a (Aa-Af), hoxb1b (Ba-Bf), hoxb4a (Ca-Cf), hoxb7a (Da-Df) and hoxb9a (Ea-Ef) expression patterns at 50% epiboly, shield, 60% epiboly, 70% epiboly, 80% epiboly and 90% epiboly stages. (F,G) Brightfield images (animal view) of hoxb1b (F) and hoxb4a (G) expression patterns at 50% and 60% epiboly, respectively. (H,I) Brightfield images (vegetal view) of hoxb7a (H) and hoxb9a (I) expression patterns at 70% epiboly. Scale bar: 200 µm. Schematics are shown for each of the developmental stages with red outlining the initial expression domains of hoxb1b, -4a, -7a and -9a at the blastoderm margin. Arrowheads indicate the initial expression of Hoxb genes at the blastoderm margin during gastrulation. Dorsal side is to the right.

Hoxb morphant embryos exhibit defective mesendodermal cell ingression/migration and epiboly movement delay. (Aa-Fd) Overlay of brightfield and fluorescence images of control antisense morpholino oligonucleotide (MO) (Aa-Ad), hoxb1a MO (Ba-Bd), hoxb1b MO (Ca-Cd), hoxb4a MO (Da-Dd), hoxb7a MO (Ea-Ed) and hoxb9a MO (Fa-Fd) injected Tg(-1.8gsc:GFP) embryos at 6 hpf (shield stage in control embryos), 7 hpf (60% epiboly stage in control embryos), 9 hpf (90% epiboly stage in control embryos) and 10.5 hpf (bud stage in control embryos). Insets show separate brightfield and fluorescence images. Red arrowhead points at defective cell mesendoderm ingression at the dorsal blastoderm margin at 6 hpf. Black arrowheads point to the leading edge of mesendodermal cells migrating towards the animal pole. Arrows point to the blastoderm margin for the embryos exhibiting epiboly delay. All images are lateral view. Dorsal side is to the right. Scale bar: 200 µm. (G) Quantification of animal pole-oriented migration of mesendodermal cells [GFP-positive cells in Tg(-1.8gsc:GFP)] by the ratio of the length of the GFP-positive ingressed mesendoderm (a) to the distance from the blastoderm margin to the animal pole (b) in control MO (n=20, N=3), hoxb1a MO (n=14, N=3), hoxb1b MO (n=18, N=3), hoxb4a MO (n=20, N=3), hoxb7a MO (n=19, N=3) and hoxb9a MO (n=18, N=3) injected embryos at 7 hpf. ****P<0.0001 (one-way ANOVA). (H) Quantification of epiboly progression by the ratio of the blastoderm length (c) to the total embryo length from the animal pole to the vegetal pole (d) in control MO (n=26, N=3), hoxb1a MO (n=26, N=3), hoxb1b MO (n=25, N=3), hoxb4a MO (n=17, N=3), hoxb7a MO (n=24, N=3) and hoxb9a MO (n=17, N=3) injected embryos at 9 hpf. ****P<0.0001 (Kruskal–Wallis test). In G,H, data are shown as mean±s.e.m. ns, not significant (P>0.05).

‘Middle’ or ‘late’ Hoxb overexpressing embryos exhibit defective mesendodermal cell ingression/migration and epiboly movement delay. (Aa-Fd) Overlay of brightfield and fluorescence images of control (water) (Aa-Ad), hoxb1a mRNA (Ba-Bd), hoxb1b mRNA (Ca-Cd), hoxb4a mRNA (Da-Dd), hoxb7a mRNA (Ea-Ed) and hoxb9a mRNA (Fa-Fd) injected Tg(-1.8gsc:GFP) embryos at 6 hpf (shield stage in control embryos), 7 hpf (60% epiboly stage in control embryos), 9 hpf (90% epiboly stage in control embryos) and 10.5 hpf (bud stage in control embryos). Insets show separate brightfield and fluorescence images. Red arrowheads point to defective mesendoderm ingression at dorsal blastoderm margin at 6 hpf. Black arrowheads point to the leading edge of mesendodermal cells migrating towards the animal pole. Arrows point to the blastoderm edge for the embryos exhibiting epiboly delay. All images are lateral view. Dorsal side is to the right. Scale bar: 200 µm. (G) Quantification of animal pole-oriented migration of mesendodermal cells [GFP-positive cells in Tg(-1.8gsc:GFP)] by the ratio of the length of the GFP-positive ingressed mesendoderm (a) to the distance from the blastoderm margin to the animal pole (b) in water (n=24, N=3), hoxb1a mRNA (n=22, N=3), hoxb1b mRNA (n=21, N=3), hoxb4a mRNA (n=22, N=3), hoxb7a mRNA (n=20, N=3) and hoxb9a mRNA (n=20, N=3) injected embryos at 7 hpf. ****P<0.0001 (one-way ANOVA). (H) Quantification of epiboly progression by the ratio of the blastoderm length (c) to the total embryo length from the animal pole to the vegetal pole (d) in water (n=34, N=3), hoxb1a mRNA (n=26, N=3), hoxb1b mRNA (n=31, N=3), hoxb4a mRNA (n=22, N=3), hoxb7a mRNA (n=29, N=3) and hoxb9a mRNA (n=22, N=3) injected embryos at 9 hpf. ****P<0.0001 (Kruskal–Wallis test). In G,H, data are shown as mean±s.e.m. ns, not significant (P>0.05).

Hoxb expression is required for proper mesendoderm morphogenesis. (A) Schematic of DiI cell labeling at the lateral blastoderm margin at 50% epiboly for hoxb1b morphants. (Ba-Cc) Overlay of brightfield and fluorescence images of labeled cells in control (Ba-Bc) and hoxb1b morphants (Ca-Cc) at 0 min (50% epiboly, just after labeling), 30 min and 60 min after labeling. Scale bar: 200 µm. (D) Percentage of control (black; n=20, N=3) and hoxb1b morphant (red; n=10, N=3) embryos with all labeled cells having completed their ingression as a function of time after the labeling at 50% epiboly. ****P<0.0001 (Mann–Whitney test). (E) Schematic of DiI cell labeling at the lateral blastoderm margin at 60% epiboly for hoxb4a morphants. (Fa-Gc) Overlay of brightfield and fluorescence images of labeled cells in control (Fa-Fc) and hoxb4a morphants (Ga-Gc) at 0 min (60% epiboly, just after labeling), 15 min and 30 min after labeling. Scale bar: 200 µm. (H) Percentage of control (black; n=12, N=3) and hoxb4a morphant (green; n=11, N=3) embryos with all labeled cells having completed their ingression as a function of time after labeling at 60% epiboly. ****P<0.0001 (Mann–Whitney test). (I) Schematic of DiI cell labeling at the lateral blastoderm margin at 70% epiboly for hoxb7a or hoxb9a morphants. (Ja-Lc) Overlay of brightfield and fluorescence images of labeled cells in control (Ja-Jc), hoxb7a morphants (Ka-Kc) and hoxb9a morphants (La-Lc) at 0 min (70% epiboly, just after labeling), 15 min and 30 min after labeling. Scale bar: 200 µm. (M) Percentage of control (black; n=18, N=3) and hoxb7a (gray; n=12, N=3) and hoxb9a (blue; n=15, N=3) morphant embryos with all labeled cells having completed their ingression as a function of time after labeling at 70% epiboly. ****P<0.0001 (Kruskal–Wallis test). (Na-Rc) Overlay of brightfield and fluorescence images of labeled cells in control (Na-Nc), hoxb1b (Oa-Oc), hoxb4a (Pa-Pc), hoxb7a (Qa-Qc) and hoxb9a (Ra-Rc) mRNA-injected embryos at 0 min (50% epiboly, just after labeling), 30 min and 60 min after labeling. Scale bar: 200 µm. (S) Schematic of DiI cell labeling at the lateral blastoderm margin at 50% epiboly for Hoxb mRNA-injected embryos. (T) Percentage of control (black; n=11, N=3), hoxb1b (red; n=11, N=3), hoxb4a (green; n=11, N=4), hoxb7a (gray; n=11, N=4) or hoxb9a (blue; n=11, N=4) mRNA-injected embryos with all labeled cells having completed their ingression as a function of time after labeling at 50% epiboly. *P<0.05; **P<0.01; ***P<0.001 (Kruskal–Wallis test). Black arrowheads point to ingressed mesendodermal cells. Insets show magnified views of the boxed areas as separate brightfield and fluorescence images. Red arrowheads point to the leading edge of the ingressed mesendoderm. Ventral view with lateral (left side) to the right. n and N correspond to the number of embryos and independent experiments, respectively. In D,H,M,T, data are shown as mean±s.e.m. ns, not significant (P>0.05).

Hoxb expression determines the timing of mesendodermal cell ingression. (A) Schematic of mesendodermal cell movement analysis. D, dorsal; V, ventral. (B-F,I-M,P-T) Confocal fluorescence images of the lateral blastoderm margin at consecutive stages of mesendodermal cell ingression from 50% epiboly stage (0 min) onwards in control (B-F), hoxb1b morphant (I-M) and hoxb7a-overexpressing (P-T) embryos. Arrows depict the overall movement direction of cells at the blastoderm margin. Yellow, red and green arrowheads depict individual mesendodermal cells during ingression. Scale bar: 20 µm. (G,N,U) Representative tracks of mesendodermal cells undergoing ingression in control (G), hoxb1b morphant (N) and hoxb7a-overexpressing (U) embryos. Eight cells were tracked in each condition. Cells were tracked for 0-60 min (3 min/frame) in control embryos and hoxb1b morphants, and for 0-75 min (3 min/frame) in hoxb7a-overexpressing embryos. Scale bar: 20 µm. (H,O,V) Representative single-cell track of a mesendodermal cell undergoing ingression at the blastoderm margin at 50% epiboly in control (H), hoxb1b morphant (O) and hoxb7a-overexpressing (V) embryos. Dots represents each time point. Scale bar: 20 µm. (W) Average time needed for mesendodermal cells to complete ingression from 50% epiboly onwards in control (n=21, N=3), hoxb1b morphant (n=17, N=3) and hoxb7a-overexpressing (n=16, N=3) embryos. ****P<0.0001 (one-way ANOVA). (X) Average cell total velocities of mesendodermal cells undergoing ingression in control (n=21, N=3), hoxb1b morphant (n=17, N=3) and hoxb7a-overexpressing (n=16, N=3) embryos. ****P<0.0001 (one-way ANOVA). In W,X, data are shown as mean±s.e.m. n and N correspond to the number of cells and independent experiments, respectively.

Hoxb expression cell-autonomously determines the timing of mesendodermal cell ingression and their resulting position along the anterior-posterior body axis. (A) Schematic of the cell transplantation assay and subsequent 4D imaging. (B-D) Representative images demonstrating the time needed for the transplanted cells to complete ingression in host embryos containing a combination of transplanted control cells (green; left) with control (B), hoxb1b MO-injected (C) or hoxb7a mRNA-injected (D) cells (magenta; right). Arrowheads point to ingressing mesendodermal cells. The timing is indicated as h:min:s. Scale bar: 100 µm. (E) Average difference in the time needed for transplanted control cells and co-transplanted control (N=5), hoxb1b MO (N=5), hoxb1b mRNA (N=5), hoxb7a MO (N=5), hoxb7a mRNA (N=5), caMypt1 mRNA (N=5) or hoxb1b MO plus caRhoA mRNA (N=5) injected cells to complete ingression. *P<0.05; **P<0.01 (one-way ANOVA). (F-J) Localization of transplanted cells along the anterior-posterior body axis within the somitic mesoderm of host embryos at the 12-somite stage for control (green) co-transplanted with control (F), hoxb1b MO (G), hoxb1 mRNA (H), hoxb7a MO (I) or hoxb7a mRNA (J) injected cells (magenta) at 40% epiboly stage. Yellow arrows outline the angles between the most anteriorly located control cells (green) and co-transplanted control, hoxb1b MO/mRNA or hoxb7a MO/mRNA cells (magenta). Scale bar: 200 µm. (K) Schematic of double transplantation assay for determining distribution patterns of transplanted cells in 12-somite stage embryos. (L) Average angles between the most anteriorly located control cells and co-transplanted control (n=10, N=3), hoxb1b MO (n=12, N=3), hoxb1b mRNA (n=8, N=3), hoxb7a MO (n=9, N=3), hoxb7a mRNA (n=9, N=3), caMypt1 mRNA (n=7, N=2) or hoxb1b MO plus caRhoA mRNA (n=9, N=2) injected cells within the somitic mesoderm of host embryos at the 12-somite stage. *P<0.05; **P<0.01; ****P<0.0001 (one-way ANOVA). n and N correspond to the number of embryos and independent experiments, respectively. In E,L, data are shown as mean±s.e.m. ns, not significant (P>0.05). An, animal pole; D, dorsal; V, ventral; Vg, vegetal pole.

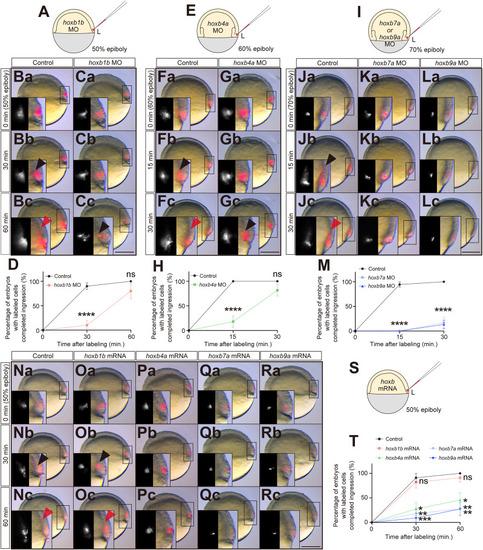
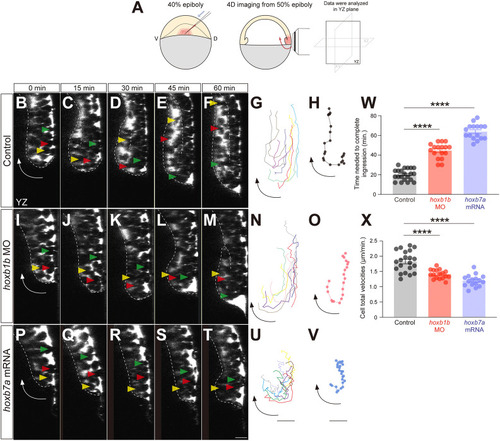
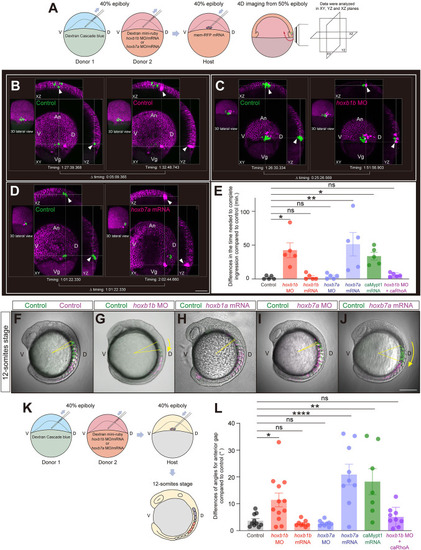
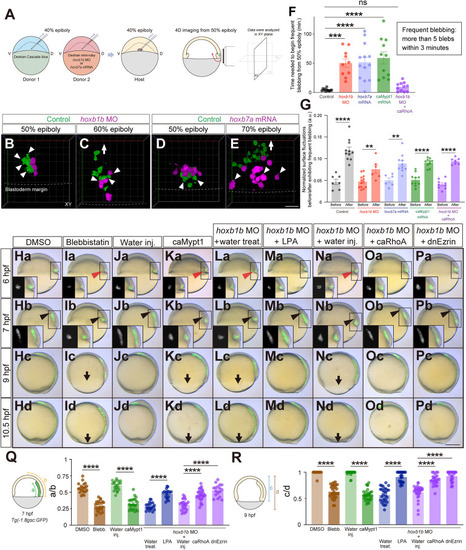
Hoxb expression affects mesendodermal cell blebbing and associated cell surface fluctuations. (A) Schematic of the cell transplantation assay and subsequent 4D imaging. D, dorsal; V, ventral. (B-E) Confocal fluorescence images (3D projection) of transplanted control (green) and hoxb1b MO (B,C) or hoxb7a mRNA (D,E) injected cells (magenta) at 50% epiboly (B,D) and 60% (C) or 70% (E) epiboly. Arrowheads point to cellular blebs. Arrow demarcates the migration direction of ingressed mesendodermal cells towards the animal pole. Dashed lines depict the borders between blastoderm margin and yolk. Scale bar: 60 µm. (F) Time needed for mesendodermal cells to begin frequent blebbing after the onset of imaging in control (n=12, N=4), hoxb1b MO (n=10, N=3), hoxb7a mRNA (n=13, N=4), caMypt1 mRNA (n=11, N=3) and hoxb1b MO plus caRhoA mRNA (n=11, N=4) injected cells. Frequent blebbing is defined as the state when a cell shows more than five blebs within 3 min. ***P<0.001, ****P<0.0001 (one-way ANOVA). (G) Normalized surface fluctuations of control (n=7, N=3 before; n=11, N=3 after), hoxb1b MO (n=13, N=3 before; n=6, N=3 after), hoxb7a mRNA (n=6, N=3 before; n=10, N=3 after), caMypt1 mRNA (n=10, N=3 before; n=10, N=3 after) and hoxb1b MO plus caRhoA mRNA (n=9, N=3 before; n=7, N=3 after) injected cells in the states before or after exhibiting frequent blebbing. **P<0.01; ****P<0.0001 (Mann–Whitney test). (Ha-Pd) Overlay of brightfield and fluorescence images of DMSO-treated (Ha-Hd), blebbistatin-treated (Ia-Id), water-injected (Ja-Jd), caMypt1 mRNA-injected (Ka-Kd) embryos, and water-treated (La-Ld), LPA-treated (Ma-Md), water-injected (Na-Nd) and caRhoA mRNA-injected (Oa-Od) and dnEzrin mRNA-injected (Pa-Pd) hoxb1b morphant embryos at 6 hfp, 7 hpf, 9 hpf and 10.5 hpf. Red arrowheads point to defective mesendodermal cell ingression at the dorsal blastoderm margin at 6 hpf. Black arrowheads point to the leading edge of mesendodermal cells migrating towards the animal pole. Arrows point to the blastoderm margin at 9 hpf. Dorsal side is to the right. Insets show separate brightfield and fluorescence images. Scale bar: 200 µm. (Q) Quantification of animal pole-oriented migration of mesendodermal cells [GFP-positive cells in Tg(-1.8gsc:GFP)] by the ratio of the length of the GFP-positive ingressed mesendoderm (a) to the distance from the blastoderm margin to the animal pole (b) in DMSO-treated (n=21, N=3), blebbistatin-treated (n=22, N=3), water-injected (n=22, N=3), caMypt1 mRNA-injected (n=23, N=3) embryos, and water-treated (n=20, N=3), LPA-treated (n=17, N=3), water-injected (n=24, N=3), caRhoA mRNA-injected (n=28, N=3) and dnEzrin mRNA-injected (n=17, N=3) hoxb1b morphant embryos at 7 hpf. ****P<0.0001 (one-way ANOVA). (R) Quantification of epiboly progression by the ratio of the blastoderm length (c) to the total embryo length from the animal pole to the vegetal pole (d) in DMSO-treated (n=17, N=3), blebbistatin-treated (n=30, N=3), water-injected (n=28, N=3), caMypt1 mRNA-injected (n=31, N=3) embryos, and water-treated (n=29, N=3), LPA-treated (n=24, N=3), water-injected (n=30, N=3), caRhoA mRNA-injected (n=25, N=3) and dnEzrin mRNA-injected (n=31, N=3) hoxb1b morphant embryos at 9 hpf. ****P<0.0001 (Kruskal–Wallis test). In F,G,Q,R, data are shown as mean±s.e.m. ns, not significant (P>0.05).

Acknowledgments
This image is the copyrighted work of the attributed author or publisher, and ZFIN has permission only to display this image to its users. Additional permissions should be obtained from the applicable author or publisher of the image. Full text @ Development