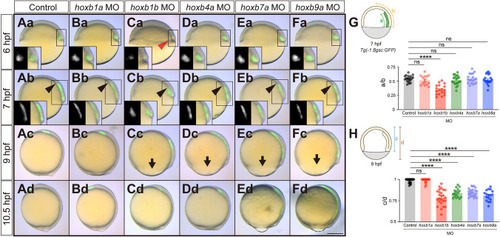
Hoxb morphant embryos exhibit defective mesendodermal cell ingression/migration and epiboly movement delay. (Aa-Fd) Overlay of brightfield and fluorescence images of control antisense morpholino oligonucleotide (MO) (Aa-Ad), hoxb1a MO (Ba-Bd), hoxb1b MO (Ca-Cd), hoxb4a MO (Da-Dd), hoxb7a MO (Ea-Ed) and hoxb9a MO (Fa-Fd) injected Tg(-1.8gsc:GFP) embryos at 6 hpf (shield stage in control embryos), 7 hpf (60% epiboly stage in control embryos), 9 hpf (90% epiboly stage in control embryos) and 10.5 hpf (bud stage in control embryos). Insets show separate brightfield and fluorescence images. Red arrowhead points at defective cell mesendoderm ingression at the dorsal blastoderm margin at 6 hpf. Black arrowheads point to the leading edge of mesendodermal cells migrating towards the animal pole. Arrows point to the blastoderm margin for the embryos exhibiting epiboly delay. All images are lateral view. Dorsal side is to the right. Scale bar: 200 µm. (G) Quantification of animal pole-oriented migration of mesendodermal cells [GFP-positive cells in Tg(-1.8gsc:GFP)] by the ratio of the length of the GFP-positive ingressed mesendoderm (a) to the distance from the blastoderm margin to the animal pole (b) in control MO (n=20, N=3), hoxb1a MO (n=14, N=3), hoxb1b MO (n=18, N=3), hoxb4a MO (n=20, N=3), hoxb7a MO (n=19, N=3) and hoxb9a MO (n=18, N=3) injected embryos at 7 hpf. ****P<0.0001 (one-way ANOVA). (H) Quantification of epiboly progression by the ratio of the blastoderm length (c) to the total embryo length from the animal pole to the vegetal pole (d) in control MO (n=26, N=3), hoxb1a MO (n=26, N=3), hoxb1b MO (n=25, N=3), hoxb4a MO (n=17, N=3), hoxb7a MO (n=24, N=3) and hoxb9a MO (n=17, N=3) injected embryos at 9 hpf. ****P<0.0001 (Kruskal–Wallis test). In G,H, data are shown as mean±s.e.m. ns, not significant (P>0.05).
|
