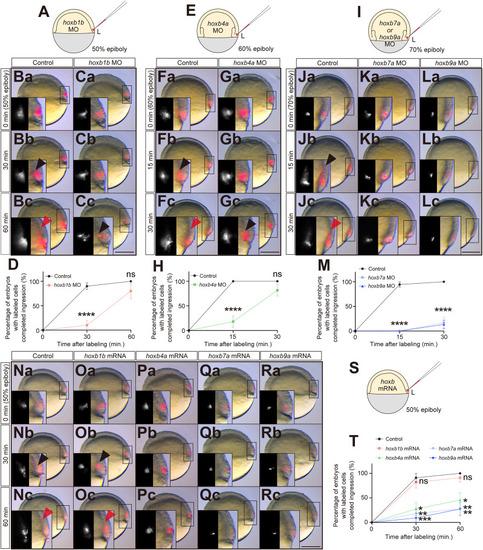
Hoxb expression is required for proper mesendoderm morphogenesis. (A) Schematic of DiI cell labeling at the lateral blastoderm margin at 50% epiboly for hoxb1b morphants. (Ba-Cc) Overlay of brightfield and fluorescence images of labeled cells in control (Ba-Bc) and hoxb1b morphants (Ca-Cc) at 0 min (50% epiboly, just after labeling), 30 min and 60 min after labeling. Scale bar: 200 µm. (D) Percentage of control (black; n=20, N=3) and hoxb1b morphant (red; n=10, N=3) embryos with all labeled cells having completed their ingression as a function of time after the labeling at 50% epiboly. ****P<0.0001 (Mann–Whitney test). (E) Schematic of DiI cell labeling at the lateral blastoderm margin at 60% epiboly for hoxb4a morphants. (Fa-Gc) Overlay of brightfield and fluorescence images of labeled cells in control (Fa-Fc) and hoxb4a morphants (Ga-Gc) at 0 min (60% epiboly, just after labeling), 15 min and 30 min after labeling. Scale bar: 200 µm. (H) Percentage of control (black; n=12, N=3) and hoxb4a morphant (green; n=11, N=3) embryos with all labeled cells having completed their ingression as a function of time after labeling at 60% epiboly. ****P<0.0001 (Mann–Whitney test). (I) Schematic of DiI cell labeling at the lateral blastoderm margin at 70% epiboly for hoxb7a or hoxb9a morphants. (Ja-Lc) Overlay of brightfield and fluorescence images of labeled cells in control (Ja-Jc), hoxb7a morphants (Ka-Kc) and hoxb9a morphants (La-Lc) at 0 min (70% epiboly, just after labeling), 15 min and 30 min after labeling. Scale bar: 200 µm. (M) Percentage of control (black; n=18, N=3) and hoxb7a (gray; n=12, N=3) and hoxb9a (blue; n=15, N=3) morphant embryos with all labeled cells having completed their ingression as a function of time after labeling at 70% epiboly. ****P<0.0001 (Kruskal–Wallis test). (Na-Rc) Overlay of brightfield and fluorescence images of labeled cells in control (Na-Nc), hoxb1b (Oa-Oc), hoxb4a (Pa-Pc), hoxb7a (Qa-Qc) and hoxb9a (Ra-Rc) mRNA-injected embryos at 0 min (50% epiboly, just after labeling), 30 min and 60 min after labeling. Scale bar: 200 µm. (S) Schematic of DiI cell labeling at the lateral blastoderm margin at 50% epiboly for Hoxb mRNA-injected embryos. (T) Percentage of control (black; n=11, N=3), hoxb1b (red; n=11, N=3), hoxb4a (green; n=11, N=4), hoxb7a (gray; n=11, N=4) or hoxb9a (blue; n=11, N=4) mRNA-injected embryos with all labeled cells having completed their ingression as a function of time after labeling at 50% epiboly. *P<0.05; **P<0.01; ***P<0.001 (Kruskal–Wallis test). Black arrowheads point to ingressed mesendodermal cells. Insets show magnified views of the boxed areas as separate brightfield and fluorescence images. Red arrowheads point to the leading edge of the ingressed mesendoderm. Ventral view with lateral (left side) to the right. n and N correspond to the number of embryos and independent experiments, respectively. In D,H,M,T, data are shown as mean±s.e.m. ns, not significant (P>0.05).
|
