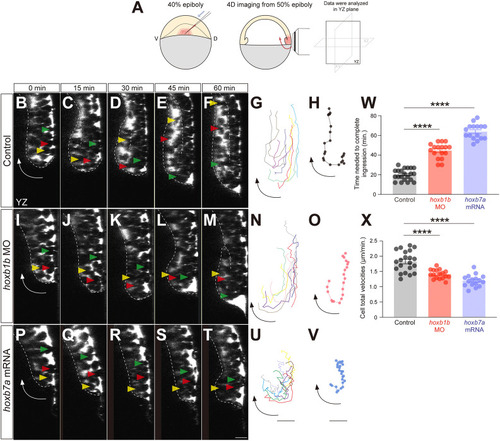
Hoxb expression determines the timing of mesendodermal cell ingression. (A) Schematic of mesendodermal cell movement analysis. D, dorsal; V, ventral. (B-F,I-M,P-T) Confocal fluorescence images of the lateral blastoderm margin at consecutive stages of mesendodermal cell ingression from 50% epiboly stage (0 min) onwards in control (B-F), hoxb1b morphant (I-M) and hoxb7a-overexpressing (P-T) embryos. Arrows depict the overall movement direction of cells at the blastoderm margin. Yellow, red and green arrowheads depict individual mesendodermal cells during ingression. Scale bar: 20 µm. (G,N,U) Representative tracks of mesendodermal cells undergoing ingression in control (G), hoxb1b morphant (N) and hoxb7a-overexpressing (U) embryos. Eight cells were tracked in each condition. Cells were tracked for 0-60 min (3 min/frame) in control embryos and hoxb1b morphants, and for 0-75 min (3 min/frame) in hoxb7a-overexpressing embryos. Scale bar: 20 µm. (H,O,V) Representative single-cell track of a mesendodermal cell undergoing ingression at the blastoderm margin at 50% epiboly in control (H), hoxb1b morphant (O) and hoxb7a-overexpressing (V) embryos. Dots represents each time point. Scale bar: 20 µm. (W) Average time needed for mesendodermal cells to complete ingression from 50% epiboly onwards in control (n=21, N=3), hoxb1b morphant (n=17, N=3) and hoxb7a-overexpressing (n=16, N=3) embryos. ****P<0.0001 (one-way ANOVA). (X) Average cell total velocities of mesendodermal cells undergoing ingression in control (n=21, N=3), hoxb1b morphant (n=17, N=3) and hoxb7a-overexpressing (n=16, N=3) embryos. ****P<0.0001 (one-way ANOVA). In W,X, data are shown as mean±s.e.m. n and N correspond to the number of cells and independent experiments, respectively.
|
