|
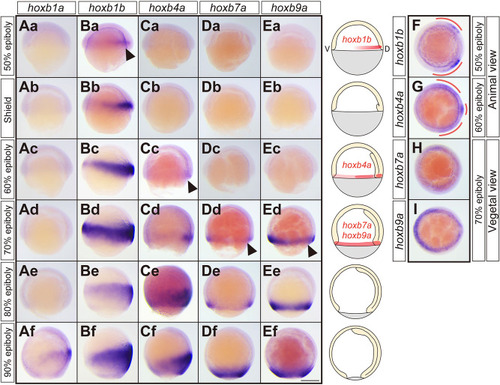
Hoxb gene expression at the blastoderm margin exhibits temporal collinearity during gastrulation. (Aa-Ef) Brightfield images (lateral views) of hoxb1a (Aa-Af), hoxb1b (Ba-Bf), hoxb4a (Ca-Cf), hoxb7a (Da-Df) and hoxb9a (Ea-Ef) expression patterns at 50% epiboly, shield, 60% epiboly, 70% epiboly, 80% epiboly and 90% epiboly stages. (F,G) Brightfield images (animal view) of hoxb1b (F) and hoxb4a (G) expression patterns at 50% and 60% epiboly, respectively. (H,I) Brightfield images (vegetal view) of hoxb7a (H) and hoxb9a (I) expression patterns at 70% epiboly. Scale bar: 200 µm. Schematics are shown for each of the developmental stages with red outlining the initial expression domains of hoxb1b, -4a, -7a and -9a at the blastoderm margin. Arrowheads indicate the initial expression of Hoxb genes at the blastoderm margin during gastrulation. Dorsal side is to the right.
|