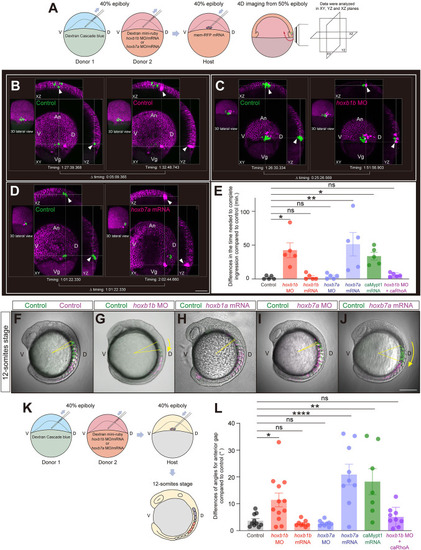
Hoxb expression cell-autonomously determines the timing of mesendodermal cell ingression and their resulting position along the anterior-posterior body axis. (A) Schematic of the cell transplantation assay and subsequent 4D imaging. (B-D) Representative images demonstrating the time needed for the transplanted cells to complete ingression in host embryos containing a combination of transplanted control cells (green; left) with control (B), hoxb1b MO-injected (C) or hoxb7a mRNA-injected (D) cells (magenta; right). Arrowheads point to ingressing mesendodermal cells. The timing is indicated as h:min:s. Scale bar: 100 µm. (E) Average difference in the time needed for transplanted control cells and co-transplanted control (N=5), hoxb1b MO (N=5), hoxb1b mRNA (N=5), hoxb7a MO (N=5), hoxb7a mRNA (N=5), caMypt1 mRNA (N=5) or hoxb1b MO plus caRhoA mRNA (N=5) injected cells to complete ingression. *P<0.05; **P<0.01 (one-way ANOVA). (F-J) Localization of transplanted cells along the anterior-posterior body axis within the somitic mesoderm of host embryos at the 12-somite stage for control (green) co-transplanted with control (F), hoxb1b MO (G), hoxb1 mRNA (H), hoxb7a MO (I) or hoxb7a mRNA (J) injected cells (magenta) at 40% epiboly stage. Yellow arrows outline the angles between the most anteriorly located control cells (green) and co-transplanted control, hoxb1b MO/mRNA or hoxb7a MO/mRNA cells (magenta). Scale bar: 200 µm. (K) Schematic of double transplantation assay for determining distribution patterns of transplanted cells in 12-somite stage embryos. (L) Average angles between the most anteriorly located control cells and co-transplanted control (n=10, N=3), hoxb1b MO (n=12, N=3), hoxb1b mRNA (n=8, N=3), hoxb7a MO (n=9, N=3), hoxb7a mRNA (n=9, N=3), caMypt1 mRNA (n=7, N=2) or hoxb1b MO plus caRhoA mRNA (n=9, N=2) injected cells within the somitic mesoderm of host embryos at the 12-somite stage. *P<0.05; **P<0.01; ****P<0.0001 (one-way ANOVA). n and N correspond to the number of embryos and independent experiments, respectively. In E,L, data are shown as mean±s.e.m. ns, not significant (P>0.05). An, animal pole; D, dorsal; V, ventral; Vg, vegetal pole.
|
