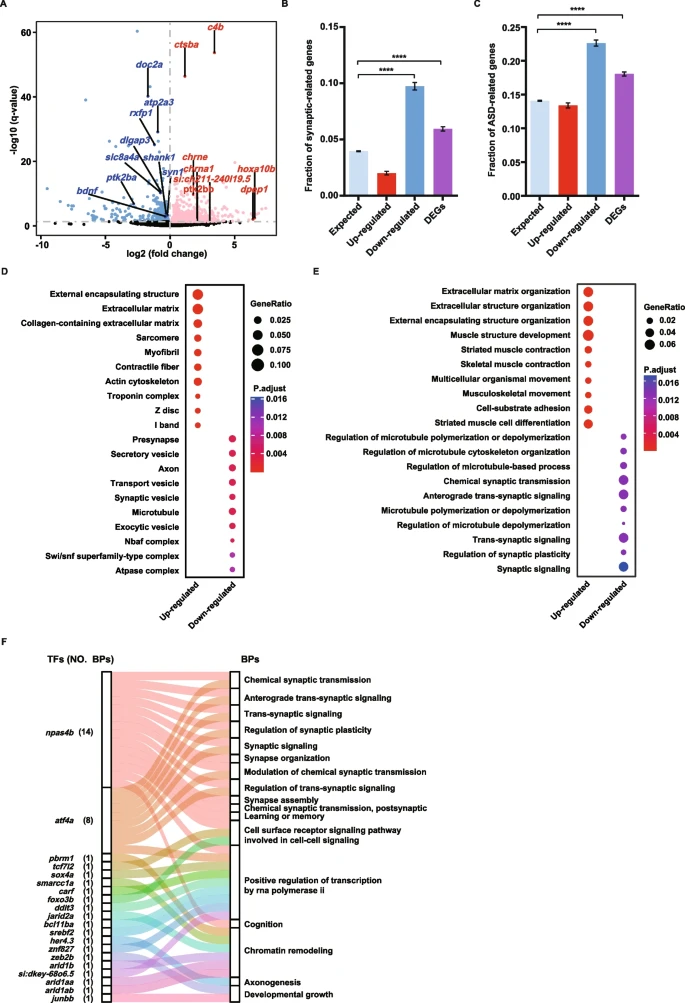
Fig. 5 Brain transcriptome sequencing reveals synaptic dysregulation in the doc2a−/−doc2b−/− mutants. A: Volcano plot for differential expression genes (DEGs) based on mRNA expression levels in the doc2a−/−doc2b−/− mutants relative to the WT. FDR < 0.05. Red dots represent 746 up-regulated genes; blue dots represent 764 down-regulated genes and grey dots represent genes with no expression change. Highlighted genes are synaptic genes associated with autism. B and C: Enrichment of synaptic genes and ASD candidate genes in up-regulated genes, down-regulated genes and all DEGs. Statistical significance was determined by two-tailed Fisher’s exact test; ****, P < 0.0001; Error bars represent the standard error of the fraction, estimated using a bootstrapping method with 500 resamplings. D and E: Enriched Gene Ontology terms of the up-regulated genes, the down-regulated genes and all DEGs in the doc2a−/−doc2b−/− mutants. Top 10 enriched cellular components (D); Top 10 enriched biological processes (E). The enrichment analysis was performed using DAVID bioinformatics tool with FDR < 0.05. F: The Sankey diagram showing the relationship between TFs and the enriched BPs with DEGs. A total of 17 enriched BPs (the right column) contain 20 TFs (the left column); Each color links a TF to the BPs that contain it
Image
Figure Caption
Acknowledgments
This image is the copyrighted work of the attributed author or publisher, and
ZFIN has permission only to display this image to its users.
Additional permissions should be obtained from the applicable author or publisher of the image.
Full text @ BMC Biol.

