
Fig. 5
- ID
- ZDB-FIG-250725-38
- Publication
- Chi et al., 2025 - doc2a and doc2b contribute to locomotor and social behaviors by down-regulating npas4b in zebrafish
- Other Figures
- All Figure Page
- Back to All Figure Page
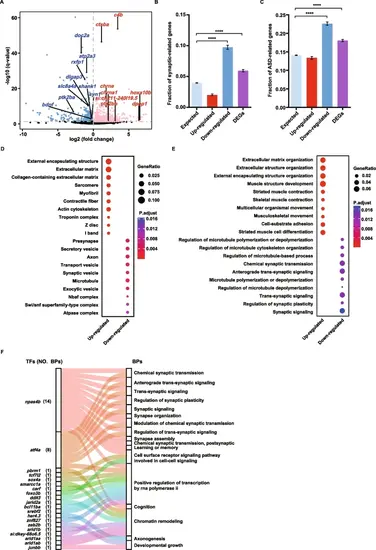
Brain transcriptome sequencing reveals synaptic dysregulation in the doc2a−/−doc2b−/− mutants. A: Volcano plot for differential expression genes (DEGs) based on mRNA expression levels in the doc2a−/−doc2b−/− mutants relative to the WT. FDR < 0.05. Red dots represent 746 up-regulated genes; blue dots represent 764 down-regulated genes and grey dots represent genes with no expression change. Highlighted genes are synaptic genes associated with autism. B and C: Enrichment of synaptic genes and ASD candidate genes in up-regulated genes, down-regulated genes and all DEGs. Statistical significance was determined by two-tailed Fisher’s exact test; ****, P < 0.0001; Error bars represent the standard error of the fraction, estimated using a bootstrapping method with 500 resamplings. D and E: Enriched Gene Ontology terms of the up-regulated genes, the down-regulated genes and all DEGs in the doc2a−/−doc2b−/− mutants. Top 10 enriched cellular components (D); Top 10 enriched biological processes (E). The enrichment analysis was performed using DAVID bioinformatics tool with FDR < 0.05. F: The Sankey diagram showing the relationship between TFs and the enriched BPs with DEGs. A total of 17 enriched BPs (the right column) contain 20 TFs (the left column); Each color links a TF to the BPs that contain it |