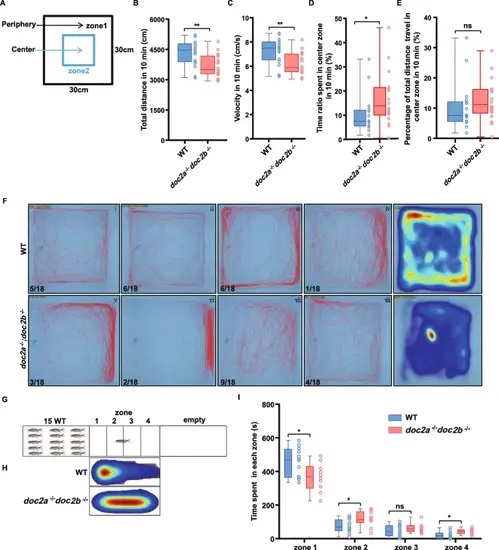
Reduced locomotion and impaired social interaction of the doc2a−/−doc2b−/− adults. A-F: Impaired locomotion activity in the doc2a−/−doc2b−/− adults. Schematic diagram of the open field test and thigmotaxis test in the WT (n = 18) and doc2a−/−doc2b−/− (n = 18) adults. Black arrow indicates the periphery zone and blue arrow indicates center zone in the blue square; the area of the peripheral zone is equal to the center zone (A). Total distance traveled by the WT and doc2a−/−doc2b−/− adults (B). Speed of movement in the WT and doc2a−/−doc2b−/− adults (C). Percentage of time spent in the center zone by the WT and doc2a−/−doc2b−/− adults (D). Percentage of total distance traveled by the WT and doc2a−/−doc2b−/− adults in the center zone (E). Representative diagrams and heat maps of motion tracks from the WT and doc2a−/−doc2b−/− adults in the open field test, with the indicated numbers of the movement patterns (F). G-I: Impaired social interaction in the doc2a−/−doc2b−/− adults. Schematic diagram of the social interaction test performed in the tank with 4 zones between a tank with 15 WT zebrafish and an empty tank (G). Representative heat maps of motion tracks from the WT (n = 12) and doc2a−/−doc2b−/− (n = 11) adults during the social interaction test (H). Comparison of time spent in each zone between the WT and doc2a−/−doc2b−/− adults (I). Statistical significance was determined using two-tailed Student’s t-test; data were combined from three biological replicates; mean ± SE; *, P < 0.05; **, P < 0.01; ****, P < 0.0001; ns, no significance
|
