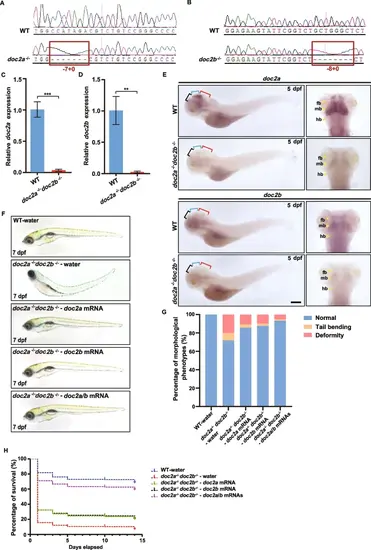
Abnormal development of doc2a−/−doc2b−/− mutants. A: The sequence chromatograms of the targeted regions from doc2a+/+ and doc2a−/−. Red boxes show the mutant genotype of doc2a with a 7 bp deletion. B: The sequence chromatogram of the targeted regions from the WT and the doc2b−/−. Red boxes show the mutant genotype of doc2b with an 8 bp deletion. C-D: Relative mRNA expression levels of doc2a (C) and doc2b (D) in the brain of the WT (n = 60) and the doc2a−/−doc2b−/− mutants (n = 60) were detected by qRT-PCR at 5 dpf. E: Representative pictures of WISH for doc2a and doc2b in the WT (n = 15) and the doc2a−/−doc2b−/− mutants (n = 15) at 5 dpf. Black brackets: forebrain; Blue brackets: midbrain; Red brackets: hindbrain. fb: forebrain; mb: midbrain; hb: hindbrain. Scale bars: 50 µm. F–H: Rescued morphological recovery and improvement in survival rate in the doc2a−/−doc2b−/− mutants with single or both doc2a or/and doc2b mRNAs. Representative morphological images of the WT injected with water and the doc2a−/−doc2b−/− mutants injected with mRNAs of doc2a or/and doc2b at 7 dpf (F). Proportion statistics of the developmental state among the WT injected with water (n = 140), the doc2a−/−doc2b−/− mutants injected with water (n = 49), the doc2a−/−doc2b−/− mutants injected with single mRNAs of doc2a (n = 104) or doc2b (n = 116) and co-injection of doc2a/b mRNAs (n = 301) (G). The survival rate in the WT injected with water (initial quantity of zebrafish: n = 240), the doc2a−/−doc2b−/− mutants injected with water (initial quantity of zebrafish: n = 450), the doc2a−/−doc2b−/− mutants injected with single mRNAs of doc2a (initial quantity of zebrafish: n = 450) or doc2b (initial quantity of zebrafish: n = 450) and co-injection of doc2a/b mRNAs (initial quantity of zebrafish: n = 450) (H). Scale bars: 200 µm. Statistical significance was determined using a two-tailed Student’s t-test; data were combined from three biological replicates
|
