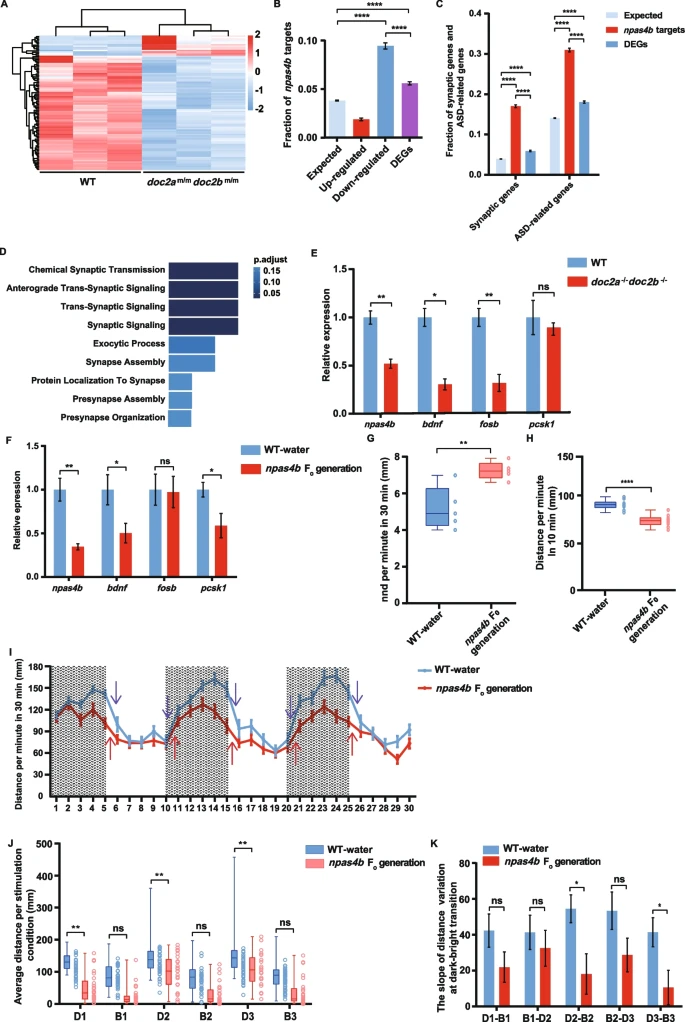
Fig. 6 Downregulation of npas4b in the doc2a−/−doc2b−/− mutants leads to downregulation of genes involved in synaptic functions. A: Differential expression pattern of naps4b targets: Heatmap analysis based on mRNA expression levels of Npas4b targets in the doc2a−/−doc2b−/− compared to those in the WT; Each column represents a sample; each row represents a gene; Red color represents a relatively increased abundance, blue color represents a relatively decreased abundance, and white color represents no change. B: Enrichment of Npas4b targets in up-regulated genes, down-regulated genes and DEGs. C: Enrichment of synaptic genes and ASD candidate genes in the DEGs and the Npas4b targets. Statistical significance was determined by two-tailed Fisher’s exact test; ****, P < 0.0001; Error bars represent the standard error of the fraction, estimated using a bootstrapping method with 500 resamplings. D: Enriched BPs in Npas4b target DEGs. Fisher’s Exact Test was used for calculating p-values. E: The expression levels of npas4b and its target genes detected by qRT-PCR in the brain of the WT (n = 20) and the doc2a−/−doc2b−/− (n = 20) at 5 dpf. F: Relative mRNA expression levels of npas4b and its target genes in the brain of the WT-water group (n = 40) and the npas4b F0 generation (n = 40) were detected by qRT-PCR at 5 dpi. G: A decline in schooling behavior in the npas4b F0 generation (n = 100) comparing with the WT-water group (n = 100) and at 7 dpi, as assessed in the shoaling test. nnd, nearest neighbor distance. H: Reduced locomotion activity in the group of npas4b F0 generation (n = 45) comparing with the WT-water group (n = 45) at 5 dpi. I-K: Impaired locomotion activity of the npas4b F0 generation larvae in the light/dark test. The average distance traveled by the WT-water group (n = 45) and the npas4b F0 generation (n = 45) larvae at 5 dpf per minute in 30 min. Purple arrows and red arrows indicate the slope variation at light/dark transitions in the WT-water group and the npas4b F0 generation larvae at 5 dpf (I). Comparison of distance traveled by the WT-water group and the npas4b F0 generation larvae in each dark condition or bright condition (J). Comparison of the slope variation in the WT-water group and the npas4b F0 generation at dark/bright transitions (K). Statistical significance was determined using a two-tailed Student’s t-test; data were combined from three biological replicates; mean ± SE; *, P < 0.05; **, P < 0.01; ***, P < 0.001; ****, P < 0.0001; ns, no significance
Image
Figure Caption
Figure Data
Acknowledgments
This image is the copyrighted work of the attributed author or publisher, and
ZFIN has permission only to display this image to its users.
Additional permissions should be obtained from the applicable author or publisher of the image.
Full text @ BMC Biol.

