IMAGE

Figure 3

ID
ZDB-IMAGE-250728-20
Source
Figures for Boi et al., 2025
Image
Figure Caption

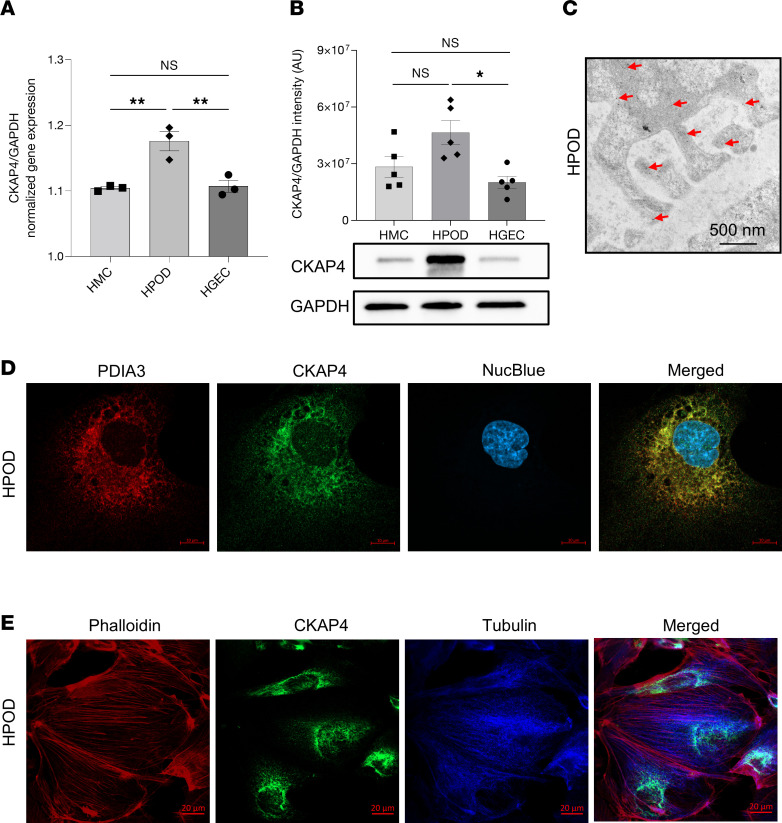
Figure 3 CKAP4 expression and localization in glomerular cells in vitro.

CKAP4 gene expression was quantified with qPCR (A) and protein expression by Western blot (B) in cultured HGECs, HMCs, and HPODs, normalized against the respective GAPDH gene/protein levels. Immunogold electron micrograph of podocyte feet and major processes; red arrows point at gold particles (C). Immunofluorescence of PDIA3 (ER marker, red), CKAP4 (green), and DAPI (blue) showing expression of CKAP4 in the ER of HPODs. Scale bar, 10 μm. (D). Immunofluorescence of phalloidin (actin cytoskeleton, red), CKAP4 (green), and tubulin (blue) showing the localization of CKAP4 in relation to cytoskeleton components (E). A: 1-way ANOVA with multiple comparisons, n = 3 per cell type. B: Kruskal-Wallis plus Dunn’s post hoc test, n = 5 per cell type. One representative blot is shown. Error bars in both panels represent average ± SEM. *P < 0.05, **P < 0.01. AU, arbitrary units; CKAP4, cytoskeleton associated protein 4; HMCs, human mesangial cells; HPODs, human podocytes; HGECs, human glomerular endothelial cells; PDIA3, protein disulfide-isomerase A3.

Acknowledgments
This image is the copyrighted work of the attributed author or publisher, and ZFIN has permission only to display this image to its users. Additional permissions should be obtained from the applicable author or publisher of the image. Full text @ JCI Insight