FIGURE SUMMARY
Title

Cytoskeleton-associated protein 4 (CKAP4) affects podocyte cytoskeleton dynamics in diabetic kidney disease

Authors
Boi, R., Lassén, E., Johansson, A., Liu, P., Chaudhari, A., Tati, R., Müller-Deile, J., Schiffer, M., Ebefors, K., Nyström, J.
Source
Full text @ JCI Insight

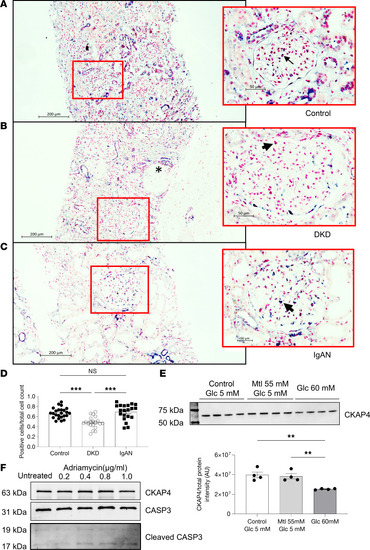
CKAP4 is downregulated in glomeruli in patients with DKD.

CKAP4 mRNA was detected using in situ hybridization in control (A), DKD patient biopsies (B), and IgAN patient biopsies (C). A purple/dark blue staining in the nuclear region characterizes cells positive for CKAP4 expression. Negative cells are characterized by a pink/red nuclear staining. The ratio of positive cells to total glomerular cells was used to quantify the extent of CKAP4 gene expression reduction in DKD (D). Completely differentiated human podocytes (HPODs) treated for 2 weeks with 60 mM glucose showed a 20%–30% reduction of CKAP4 (E). Treatment of HPODs with adriamycin for 24 hours does not cause a decrease in CKAP4 at protein level, although cleaved CASP3 level is increased in treated cells, indicating apoptosis (F). Unedited/uncropped total protein blots used for normalization calculation are provided as supplemental materials. Error bars represent average ± SEM. **P < 0.01, ***P < 0.001. D: 1-way ANOVA with Tukey’s multiple comparisons test, n = 25 (controls), 20 (DKD), 22 (IgAN) glomeruli. We scored 5 biopsies from 5 patients per group (4 for IgAN), and 5 (for controls, IgAN) or 4 (for DKD) glomeruli per biopsy. E: n = 4 replicates, 1-way ANOVA with multiple comparisons. The asterisk in B indicates a sclerotic glomerulus. The arrows in the respective zoomed-in sections of AC indicate cells showing positive staining for CKAP4. CASP3, caspase-3; CKAP4, cytoskeleton associated protein 4; DKD, diabetic kidney disease; Glc, glucose; IgAN, immunoglobulin A nephropathy, Mtl, mannitol.

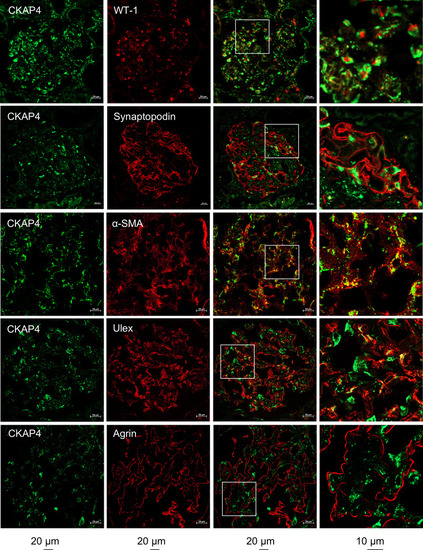
CKAP4 is expressed in all glomerular cell types in human glomeruli.

Immunofluorescence staining of human kidney tissue for CKAP4 (green) and various markers for glomerular cells (red) to illustrate CKAP4 localization in the glomerulus. The first column shows CKAP4 staining. The second column shows, respectively: WT-1, marker for podocyte nuclei; synaptopodin, marker for podocyte foot processes; α-SMA, marker for mesangial cells; Ulex Europaeus Agglutinin I, marker for endothelial cell; agrin, marker for basement membrane. The third column shows colocalization; the fourth column contains zoomed area (white squares in the third column). Representative scale bars are placed below each column. All zoomed-in areas in the last column had an area of 65 μm2. CKAP4, cytoskeleton associated protein 4; WT-1, Wilms tumor 1; α-SMA, smooth muscle actin.

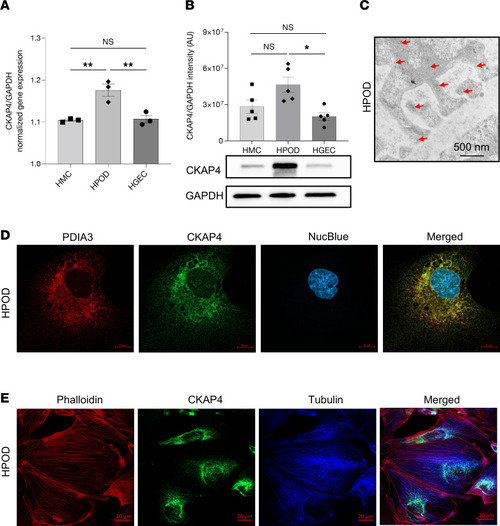
CKAP4 expression and localization in glomerular cells in vitro.

CKAP4 gene expression was quantified with qPCR (A) and protein expression by Western blot (B) in cultured HGECs, HMCs, and HPODs, normalized against the respective GAPDH gene/protein levels. Immunogold electron micrograph of podocyte feet and major processes; red arrows point at gold particles (C). Immunofluorescence of PDIA3 (ER marker, red), CKAP4 (green), and DAPI (blue) showing expression of CKAP4 in the ER of HPODs. Scale bar, 10 μm. (D). Immunofluorescence of phalloidin (actin cytoskeleton, red), CKAP4 (green), and tubulin (blue) showing the localization of CKAP4 in relation to cytoskeleton components (E). A: 1-way ANOVA with multiple comparisons, n = 3 per cell type. B: Kruskal-Wallis plus Dunn’s post hoc test, n = 5 per cell type. One representative blot is shown. Error bars in both panels represent average ± SEM. *P < 0.05, **P < 0.01. AU, arbitrary units; CKAP4, cytoskeleton associated protein 4; HMCs, human mesangial cells; HPODs, human podocytes; HGECs, human glomerular endothelial cells; PDIA3, protein disulfide-isomerase A3.

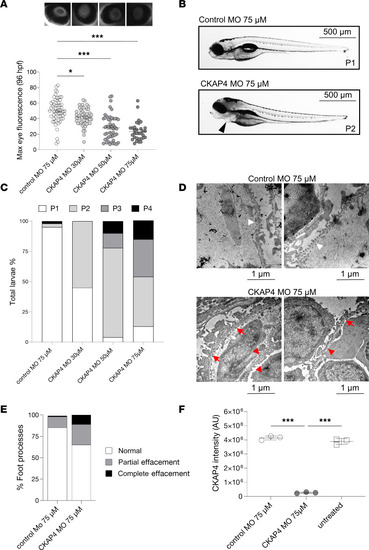
CKAP4 zebrafish homolog knockdown causes proteinuria and podocyte FPE.

CKAP4 was knocked down in zebrafish using MO in different concentrations, 30, 50, and 75 μM MO. Proteinuria was measured by reduction of eye fluorescence (A). Example of normal phenotype (P1, no edema) and fish with mild edema (P2) in CKAP4 MO; the arrow points at pericardial edema (B). Assessment of fish phenotypes in the different groups; from P1 to P4 (severe edema) was conducted with reference to Hanke et al. (25, 27) and Ursu et al. (26) (C). Representative electron microscopy pictures of the filtration barrier of zebrafish glomeruli from control MO and CKAP4 MO (75 μM). Control MO shows normal podocyte foot processes (this pattern is indicated with short white arrows) while the CKAP4 MO shows podocyte FPE (partial effacement patterns are indicated with red arrows, complete effacement with short red arrows) (D). Quantification of podocyte FPE percentages in control MO and CKAP4 MO shows increased effacement in CKAP4 MO–treated zebrafish (E). Validation of CKAP4 MO knockdown of CKAP4 as obtained via proteomics (F). A: a minimum of 32 larvae per group was used. Error bars: average ± SEM. *P < 0.05, ***P < 0.001, Mann-Whitney test. E: n = 336 (control MO), n = 319 (CKAP4 MO) foot processes were counted, from n = 14 (control MO) and n = 8 (CKAP4 MO) independent images per group. F: 3 independent experiments were performed; each treatment in each replicate is derived from lysate of a minimum of 8 pooled embryos. Error bars in both panels represent average ± SEM. ***P < 0.001, 1-way ANOVA with Tukey’s multiple-comparison test. CKAP4, cytoskeleton associated protein 4; MO, morpholino.

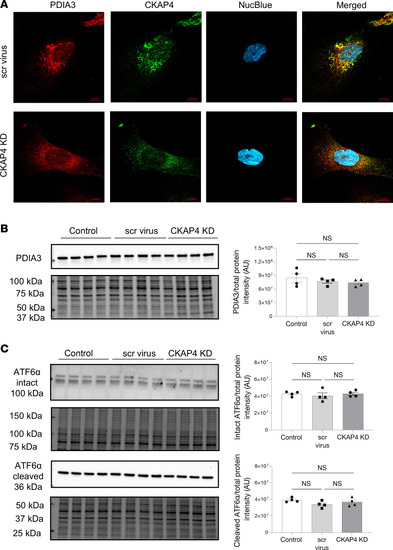
CKAP4 KD in vitro influences the shape of the ER in HPODs.

Immunofluorescence staining of the ER marker PDIA3 in scr control and CKAP4 KD HPODs. Scale bars: 10 μm. (A). Protein expression of PDIA3 was quantified in untreated control, scr control, and CKAP4 KD HPODs using Western blot (B). Protein expression of ER stress marker intact and cleaved ATF6α in untreated control, scr control, and CKAP4 KD HPODs was quantified by Western blot (C). The total protein blots used for normalization are shown below each Western blot, and the quantification graphs are shown on the left side of the panel. B: n = 4 per group. Tukey’s post hoc after 1-way ANOVA. Error bars represent average ± SEM. AU, arbitrary units; CKAP4, cytoskeleton associated protein 4; PDIA3, protein disulfide-isomerase A3; ER, endoplasmic reticulum; KD, knockdown; HPODs, human podocytes; scr, scrambled; ATF6α, activating transcription factor 6α.

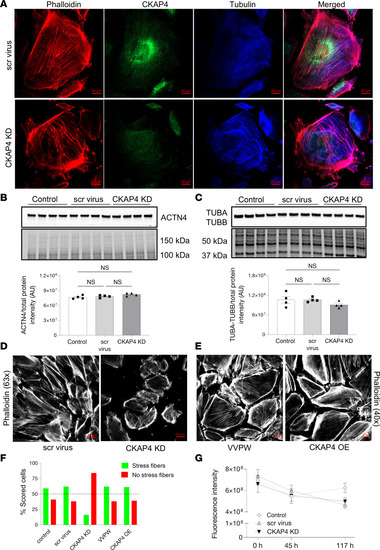
CKAP4 KD in HPODs in vitro alters the cytoskeleton.

Immunofluorescence staining of HPODs with phalloidin (red, actin fibers), tubulin (blue, microtubules), and CKAP4 (green) in scr control and CKAP4 KD. HPODs showed loss of actin stress fibers and rearranged microtubules (A). ACTN4 (B) and TUBA-TUBB (C) protein expressions were investigated by Western blot. Total protein blots and normalized protein expression graphs are also presented. Representative pictures of phalloidin staining of scr control and CKAP4 KD HPODs (D) and VVPW control and CKAP4 OE (E). Percentage of cells scored for the presence or absence of stress fibers in both CKAP4 KD and -OE experiments (F). HPOD viability in untreated, scr control, and CKAP4 KD cells from transfection time to 117 hours (G). F: a minimum of 64 cells per group were scored, and percentages are reported in the graph. G: n = 8 per time point/group, Friedman’s test was used, NS. AU, arbitrary units; CKAP4, cytoskeleton associated protein 4; KD, knockdown; OE, overexpression; HPODs, human podocytes; scr, scrambled; ACTN4, αactinin-4; TUBA, tubulin-α; TUBB, tubulin-β.

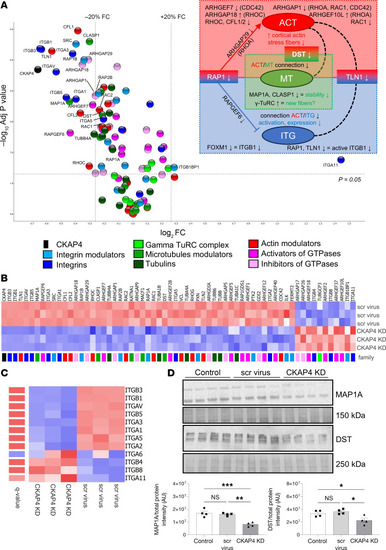
CKAP4 KD influences protein families related to cytoskeleton dynamics.

Volcano plot of selected proteins from the proteomic analysis of CKAP4 KD versus scr-treated HPODs. Dotted lines represent the P-adjusted threshold of 0.05 (y axis) and fold-change thresholds of ±20% (x axis). Protein variations within these lines were considered not significant and/or not regulated (A). The diagram on the upper right side illustrates the dysregulation of ACT (actins), MT (microtubules), and ITG (integrins). Key proteins have modulatory or structural functions in between these groups: RAP1 (ACT and ITG), DST (dystonin; ATC, and MT), and TLN1 (talin 1; ITG and ACT). Heatmap of selected proteins from the proteomics analysis. The color pattern legend identifies protein families in A and B. The P-adjusted filter was set at 0.05, and proteins were sorted by increasing fold-change. The color scale ranging from red to blue indicates degrees of upregulation (red) and downregulation (blue) or no regulation (white) (B). Heatmap of all the integrins detected in CKAP4 KD, scr-treated, and untreated cells (C). Protein lists are given in Table 3. Integrins are ranked by increasing fold-change (KD vs. scrambled). The q value scale ranges from blue (NS) to red (<0.05). No q value threshold was imposed. Confirmation of the expression of microtubule modulators MAP1A and DST in CKAP4 KD HPODs with Western blot (D). Total protein blots and normalized protein expression graphs are also presented. D: n = 4 per group, Tukey’s post hoc after 1-way ANOVA. *P < 0.05, **P < 0.01, ***P < 0.001. Error bars represent average ± SEM. AU, arbitrary units; CKAP4, cytoskeleton associated protein 4; KD, knockdown; scr, scrambled; ITGA6, integrin α6; MAP1A, microtubule associated protein 1A; DST, dystonin.

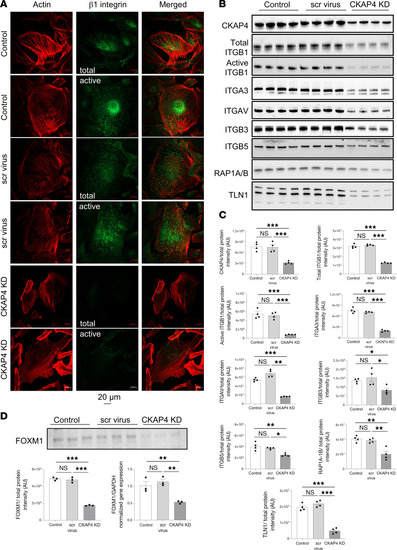
CKAP4 KD causes downregulation of integrins and influences their modulation.

Immunofluorescence images of HPODs (untreated, scr-treated control, and CKAP4 KD cells) with phalloidin (actin cytoskeleton, red) and total and active β1 integrins (green) (A). Western blots of CKAP4, total and active ITGB1, ITGAV, ITGB3, ITGB5, RAP1A/B, and TLN1 are shown (B) along with the respective normalized protein expression graphs (C). Western blots and relative normalized protein expression graph for FOXM1, together with FOXM1 gene expression (D). Unedited/uncropped total protein blots used for normalization calculation are provided as supplemental materials. C: n = 4 per group, Tukey’s post hoc after 1-way ANOVA. *P < 0.05, **P < 0.01, ***P < 0.001. Error bars represent average ± SEM. D: n = 3 per group (both gene and protein expression), Tukey’s post hoc after 1-way ANOVA. **P < 0.01, ***P < 0.001. Error bars represent average ± SEM. AU, arbitrary units; CKAP4, cytoskeleton associated protein 4; FOXM1, forkhead protein M1; KD, knockdown; HPODs, human podocytes; scr, scrambled; ITGB1, integrin β1; ITGAV, integrin αV; ITGB3, integrin β3; ITGB5, integrin β5; RAP1A/B, Ras-related protein Rap-1A/B; TLN1, talin 1.

Acknowledgments
This image is the copyrighted work of the attributed author or publisher, and ZFIN has permission only to display this image to its users. Additional permissions should be obtained from the applicable author or publisher of the image. Full text @ JCI Insight